Profit margins on processing a barrel of crude in Asia’s refineries reached a three-month low in late October, even though diesel margins remained elevated.
Despite healthy returns for diesel, weakness in gasoline and naphtha margins, which were close or even below zero, absorbed much of the upside of Asian refinery cracking margins.
The reduced availability of sour grades because of OPEC+ cuts, as well as squeezing refinery margins due to the higher import price of crude oil, also affected the availability of the final product.
With reduced sour grades out of MEG yielding most of the middle distillates, diesel availability declined. Taking into consideration Russia’s 15-day ban in diesel exports, along with China’s Golden week between 1st and 7th of October, this explains why middle distillate crack margins remain healthier compared to gasoline and naphtha, even with higher crude oil prices.

However, in terms of the seaborne trade, the ban imposed between 21st of September and 6th of October due to tight diesel supply ahead of the harvest season in Russia’s southern regions, did not have a profound effect on the clean tanker trade.

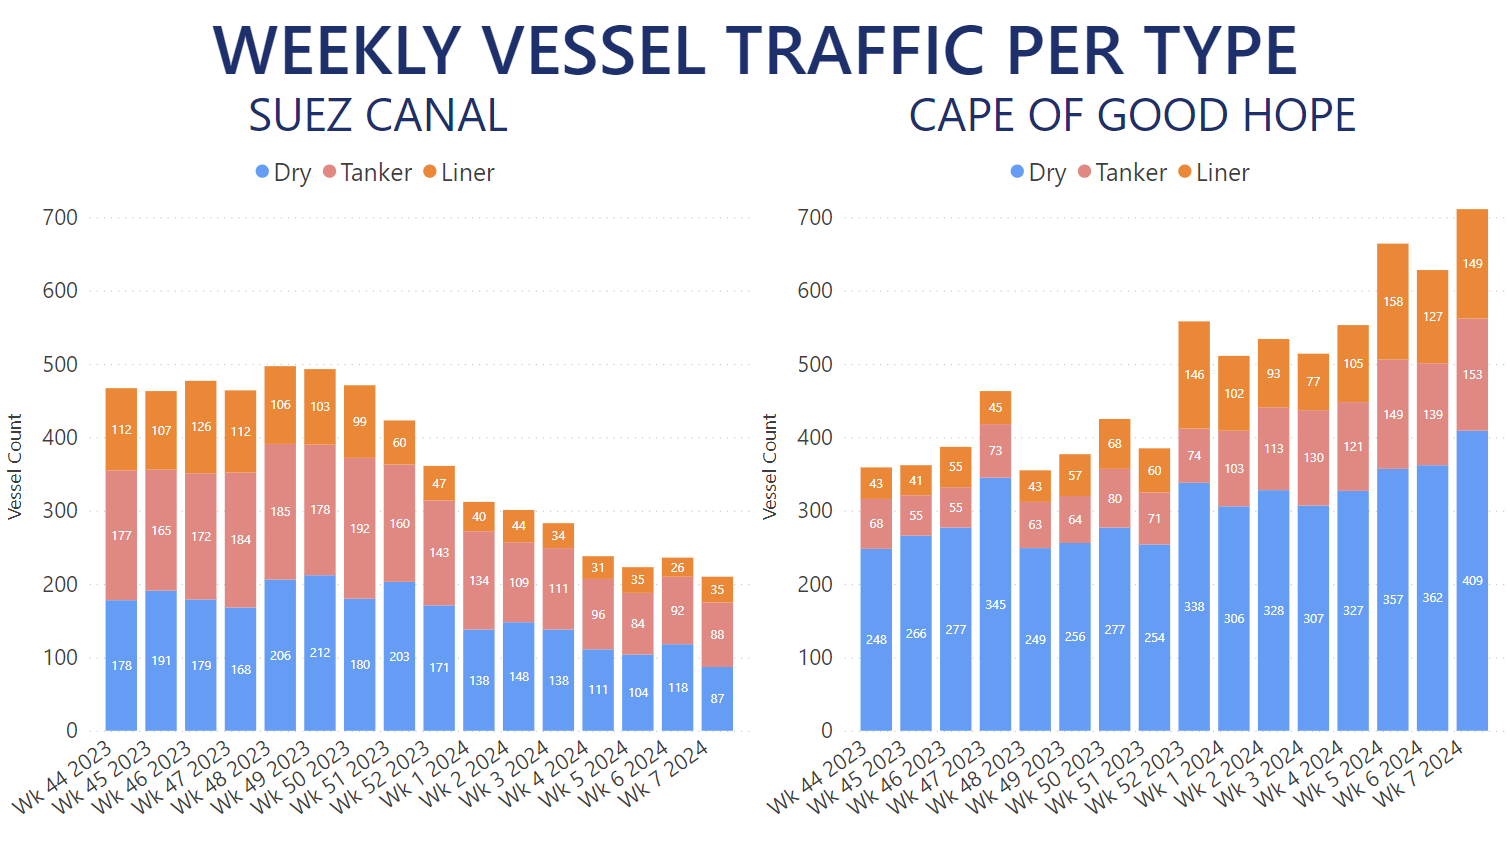
The 18% month-over-month drop in clean stems out of Russian ports affected mainly cargoes out of the Baltic heading to Turkey and Brazil for vessels greater than 30k dwt. Hence, the above factors did not translate into a profound reshuffling of seaborne trades, as shown in figures 1 and 2.
Instead, the seasonal refill of stockpiles ahead of the winter season appears to have affected most of the dirty tanker segments. The seasonal oscillation in the clean-dirty spread of vessels is currently weighted towards the clean side, where it has reached a 5-year high. This means that more tanker vessels are occupied in the clean trade.
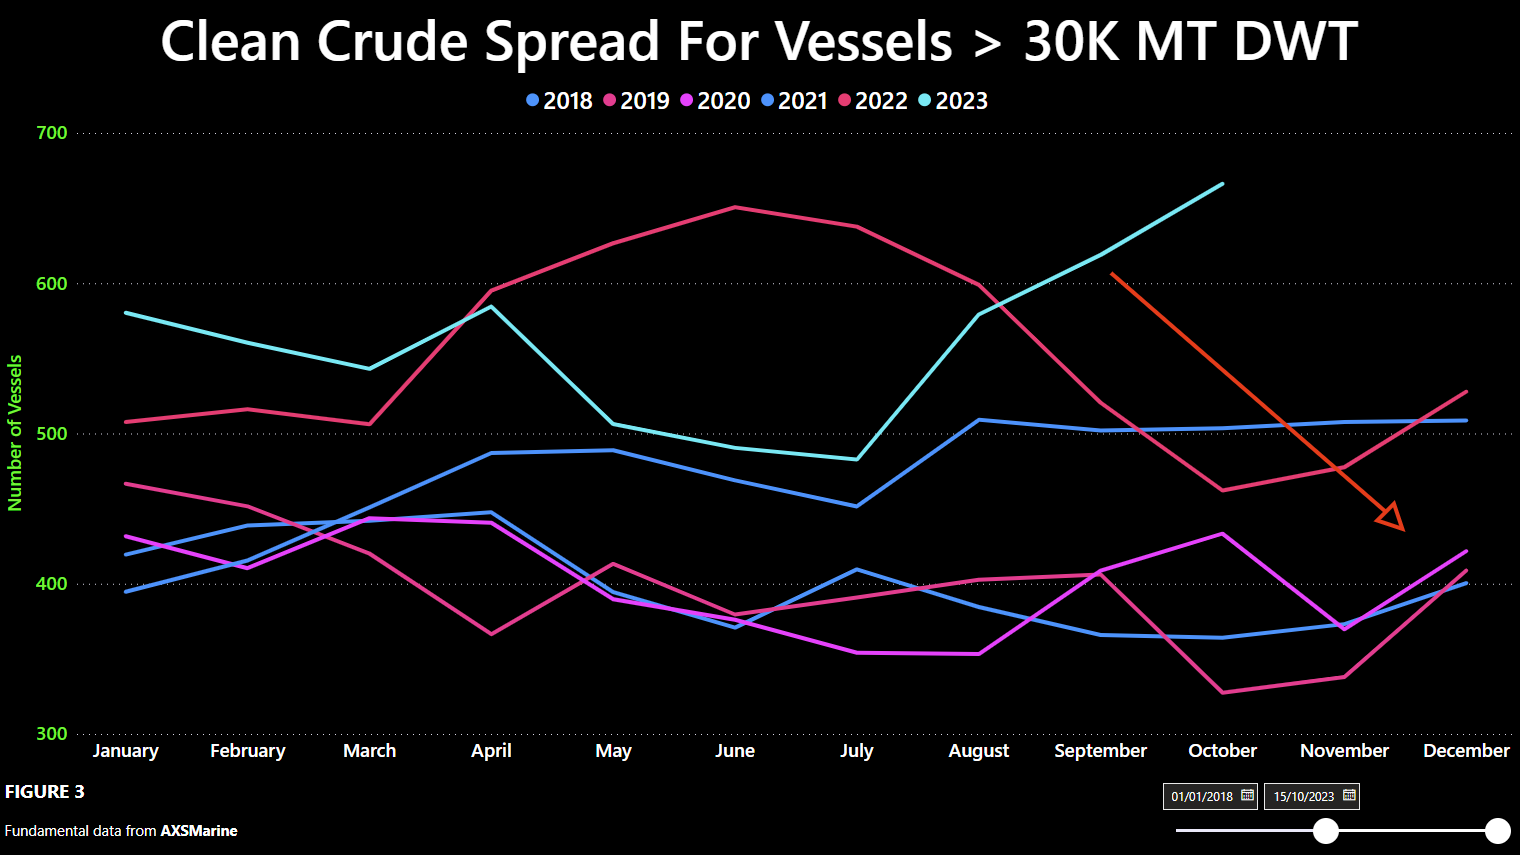
The seasonal reversal has not happened yet, as seen in figure 3. However, considering the depleted crude oil reserves on both sides of the Atlantic, a reversal of the trend is due to happen, which points towards increased crude oil stems in future. On the clean side, it is expected that China will capture most of Asia’s diesel market share during the last quarter of the year. However, this is still not demonstrated by a comparison of China’s diesel and ULSD exports, which are still a far cry from last year’s figures.

Most of these cargoes (Diesel & USLD), as shown in figure 4A, are exported from China, mainly to the Far East and Southeast Asia on MR1 and MR2, with a smaller portion diverted to UK-Continent and WAF regions, mainly on LR1 as shown by figure 4B (Diesel & ULSD).

Should China’s stems bounce back during the remainder of Q4, this will bring refinining margins in Asia into negative territory, boosting exports from that region. This is expected to happen by the end of November/beginning of December based on the current market status.
Furthermore, the lifting of US sanctions against Venezuela bodes well for Aframax and Suezmax, as Europe and US will grasp the opportunity to refill their depleted crude oil reserves with sour crude barrels at a high discount that yield a high percentage of middle distillates.
In addition, refineries on the US Gulf Coast are well-suited to take Venezuelan grades. Hence, we may well see increased crude oil flows from Venezuela to the US and then middle distillate stems from the US to EU, pointing to increased activity in the Atlantic in both dirty and clean segments.

Should clean stems out of the US coincide with a tight Pacific market due to expected Chinese exports to the Far East, we may well see a tight sub LR1 market end-2023/beginning-2024.
Currently, most of Venezuela’s exports are transported on Aframaxes to the Caribs and US. However, much will depend on Venezuela’s ability to increase its seaborne exports, as they have fallen from about 2.0 million b/d on average in 2019 before the imposition of sanctions to 500,000 b/d in October 2023, and will certainly take some time to recover.
You can follow the in-depth analysis of the Tanker Market using our Trade Flows tool. Trade Flows allows you to discover comprehensive insights on seasonality and a lot more.