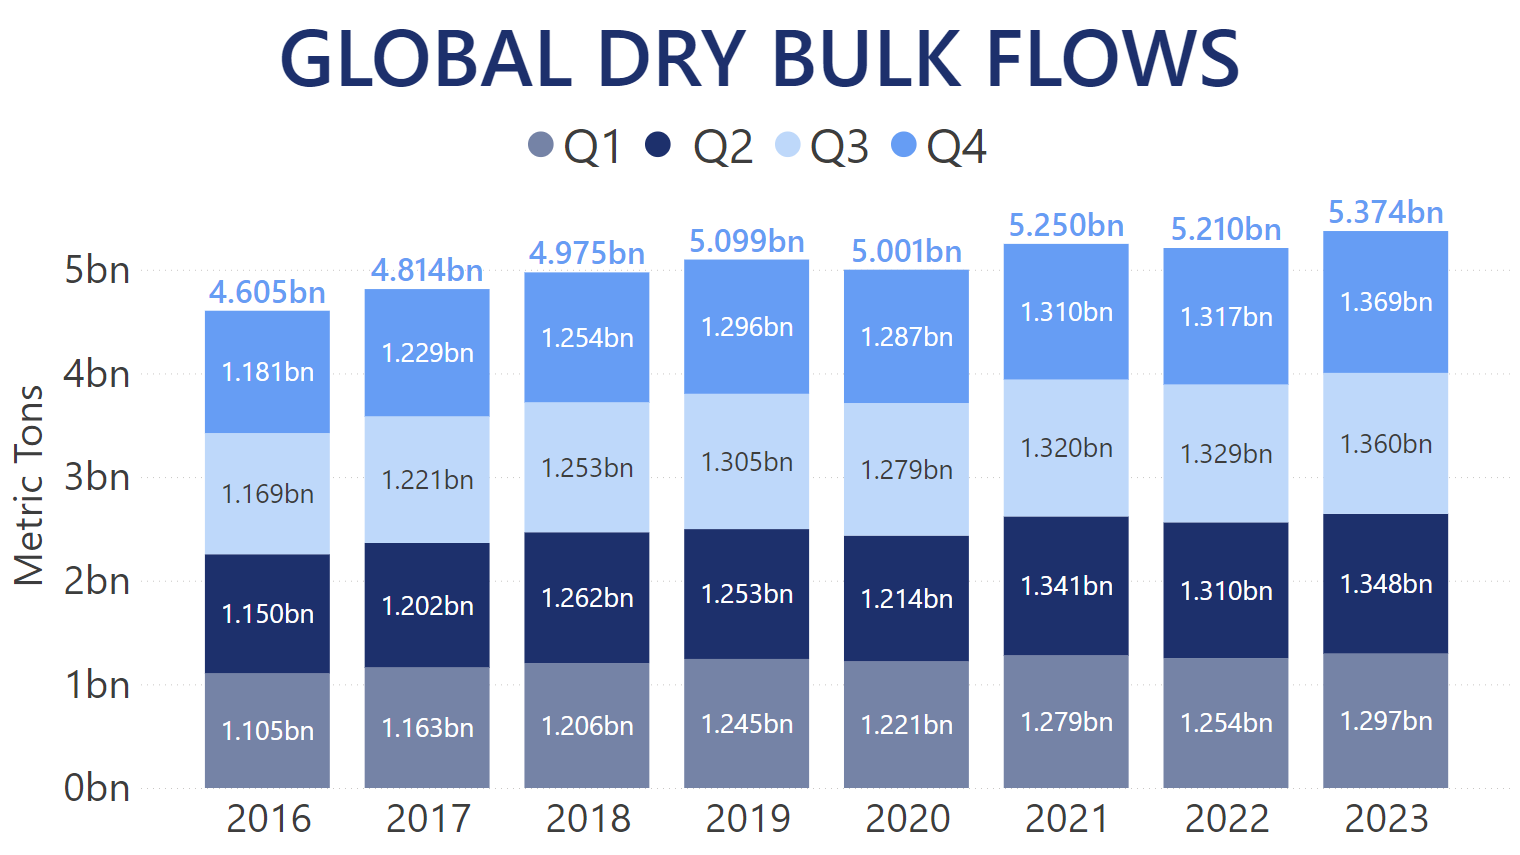
Global Dry Bulk seaborne trade totalled over 5.37bn MT of commodities shipped in 2023, setting a new all-time record for quantities transported according to our Trade Flows data. Every single quarter of last year set its own record, surpassing 2022 levels by over 3.1% on average, with the strongest year-over-year performance achieved in Q4 of 2023. In terms of the previous highest Dry Bulk quantities shipped, 2023 saw over 2.3% more cargo carried worldwide. Over 150,000 individual laden legs were carried out by Dry Bulkers last year, virtually on par with 2022 levels. The active fleet, however, increased by about 3% overall, with the Ultramax segment growing the most at over 8% compared to its vessel count in 2022. The Panamax active fleet gained over 4% year-over-year, while Capesize fleet between 120K and 220K MT of deadweight was boosted in numbers by just under 3%.
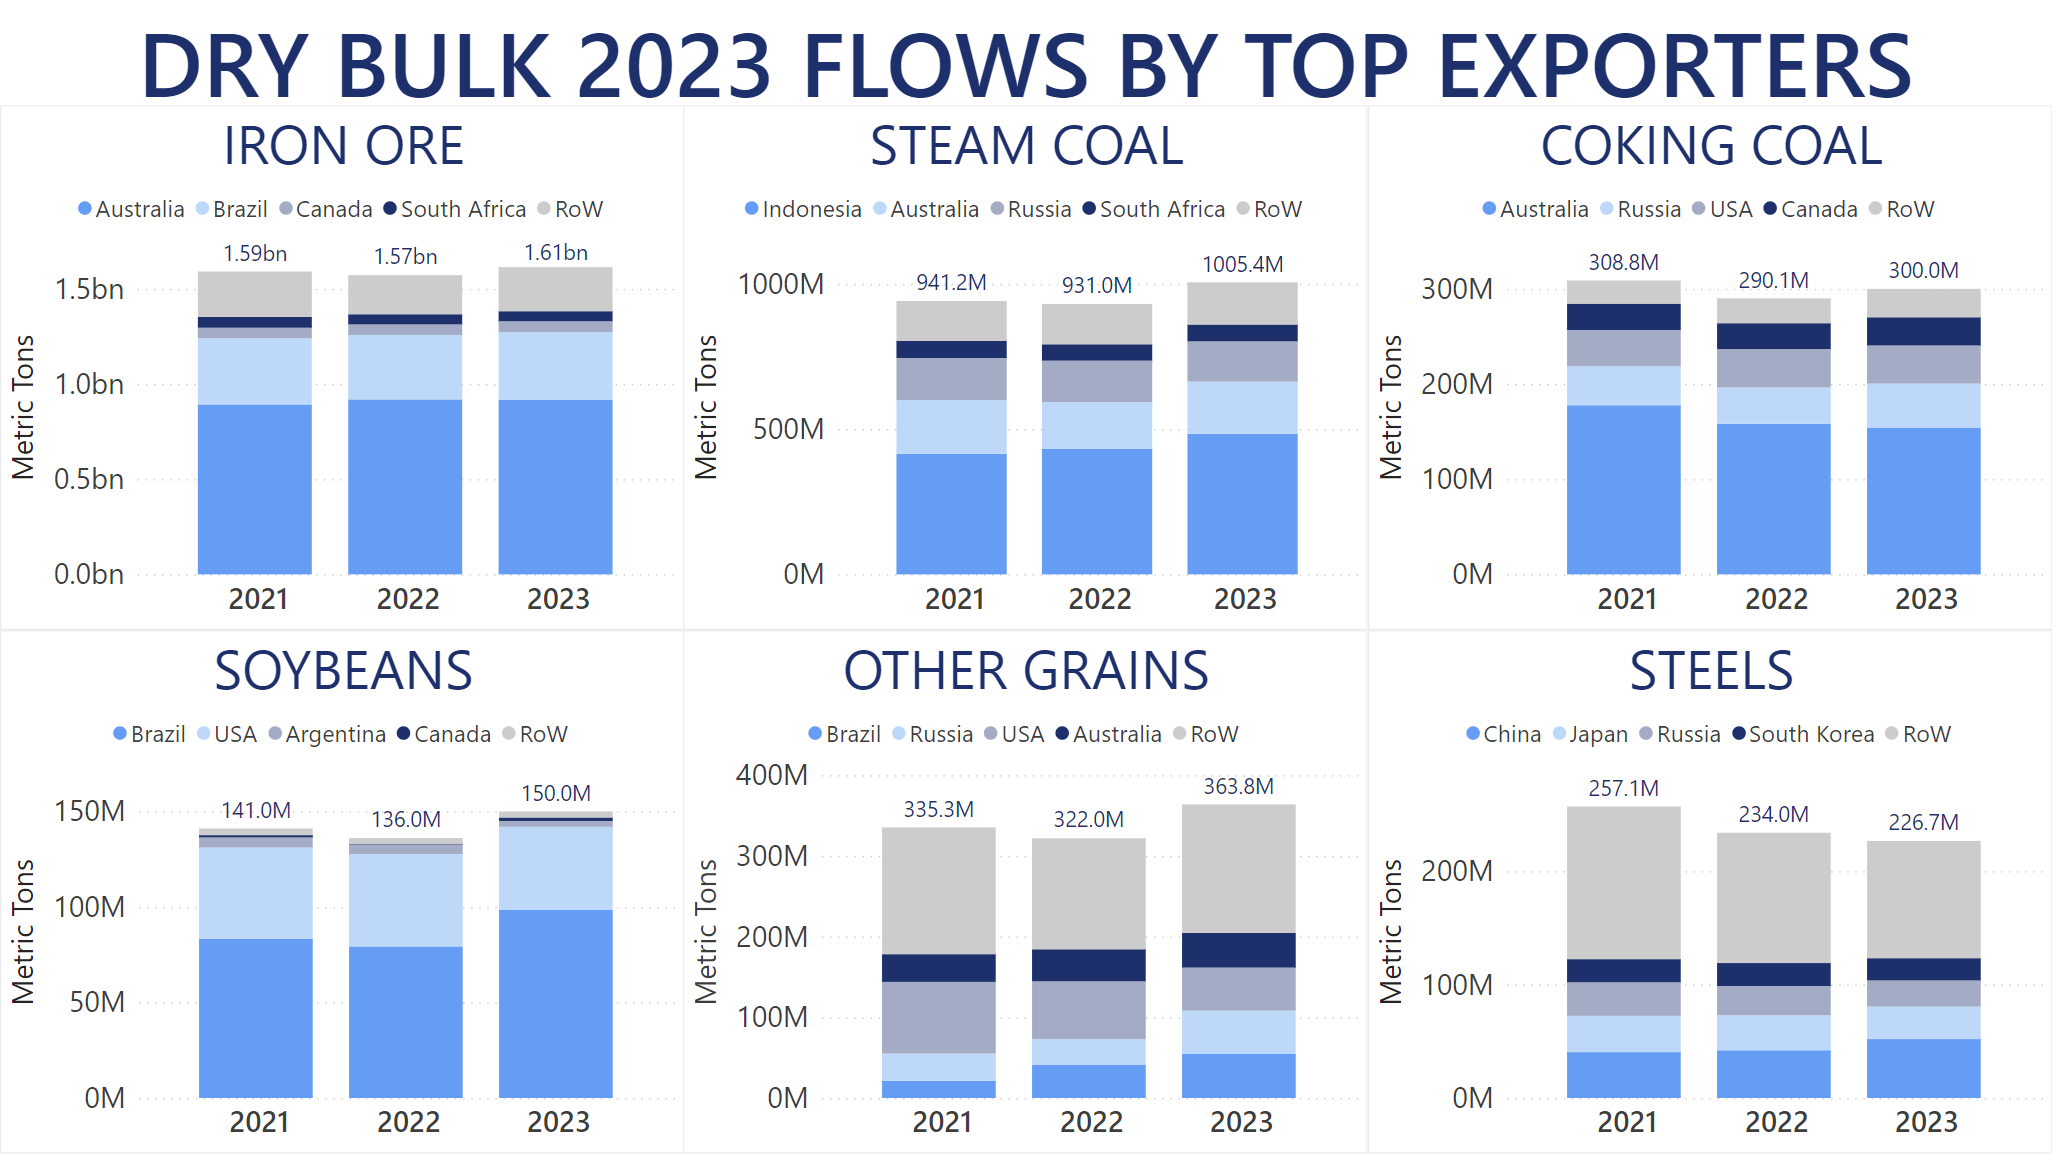
The year-over-year boost for 2023 Dry Bulk commodities was distributed mostly universally across the major commodities. Iron Ore, the most commonly shipped Dry Bulk cargo worldwide, exceeded 1.6bn MT for the first time in 2023 for a 2.7% year-over-year increase. The largest exporter of Iron Ore – Australia – actually decreased its output by 0.2% year-over-year in 2023, with just under 918m MT discharged across the globe.
However, this did not offset supply boosts by the other major exporters. Brazil marked a 4.6% year-over-year increase with over 354m MT shipped, Canada increased its output by over 4.2% compared to 2022 shipments. 2023 was also notable for India, which supplied over 40m MT of Iron Ore for a 183.9% year-over-year gain. Ukrainian supply of this commodity was virtually non-existent as the country still hampered by the Russian aggression saw its Iron Ore exports lose another 89.7% year-over-year.
In the Steam Coal market – the second-most common Dry Bulk commodity – quantities shipped in 2023 surpassed 1bn MT for the first time in history. This translated into an 8% year-over-year boost. Indonesia and Australia shipped 12.2% and 11.3% more Steam Coal than in 2022, respectively. Meanwhile, Russia saw its exports of seaborne cargoes drop by 2.9% year-over-year.
Coking Coal shipments increased by 3.4% year-over-year in 2023. However, the largest exporter of this cargo – Australia – shipped less than 154.3m MT, which is 2.5% less than 2022 levels. Russia regained its Top 2 spot, after boosting its output by over 21.3% year-over-year, with Canada also increasing its exports by 9.4%.
Soybeans supply was a mixed bag last year, with Brazil shipping nearly 100m MT of cargo for an absolute record in this market, translating into a 24.1% year-over-year increase. However, the US and Argentina saw their shipments drop by 10.1% and 38.7% year-over-year respectively. Due to its weak 2022 performance, Canada's 1.8m MT of Soybeans translated into a bombastic 355.7% year-over-year boost. Overall shipments of this commodity increased by over 10% compared to 2022 levels.
Other Grain products also registered a significant boost by 13% year-over-year in 2023. Brazil supplied over 54.5m MT of cargo in this market, increasing its 2022 output by 31.8%. Meanwhile Russia nearly overtook it for the Top 1 spot with over 53.6m MT of commodities registering a 70.3% year-over-year improvement. More than 46.3m MT of these shipments constituted of Wheat.
Australia also boosted its Wheat shipments in 2023, with over 28.1m MT of cargo shipped, translating into a 10.1% year-over-year boost.
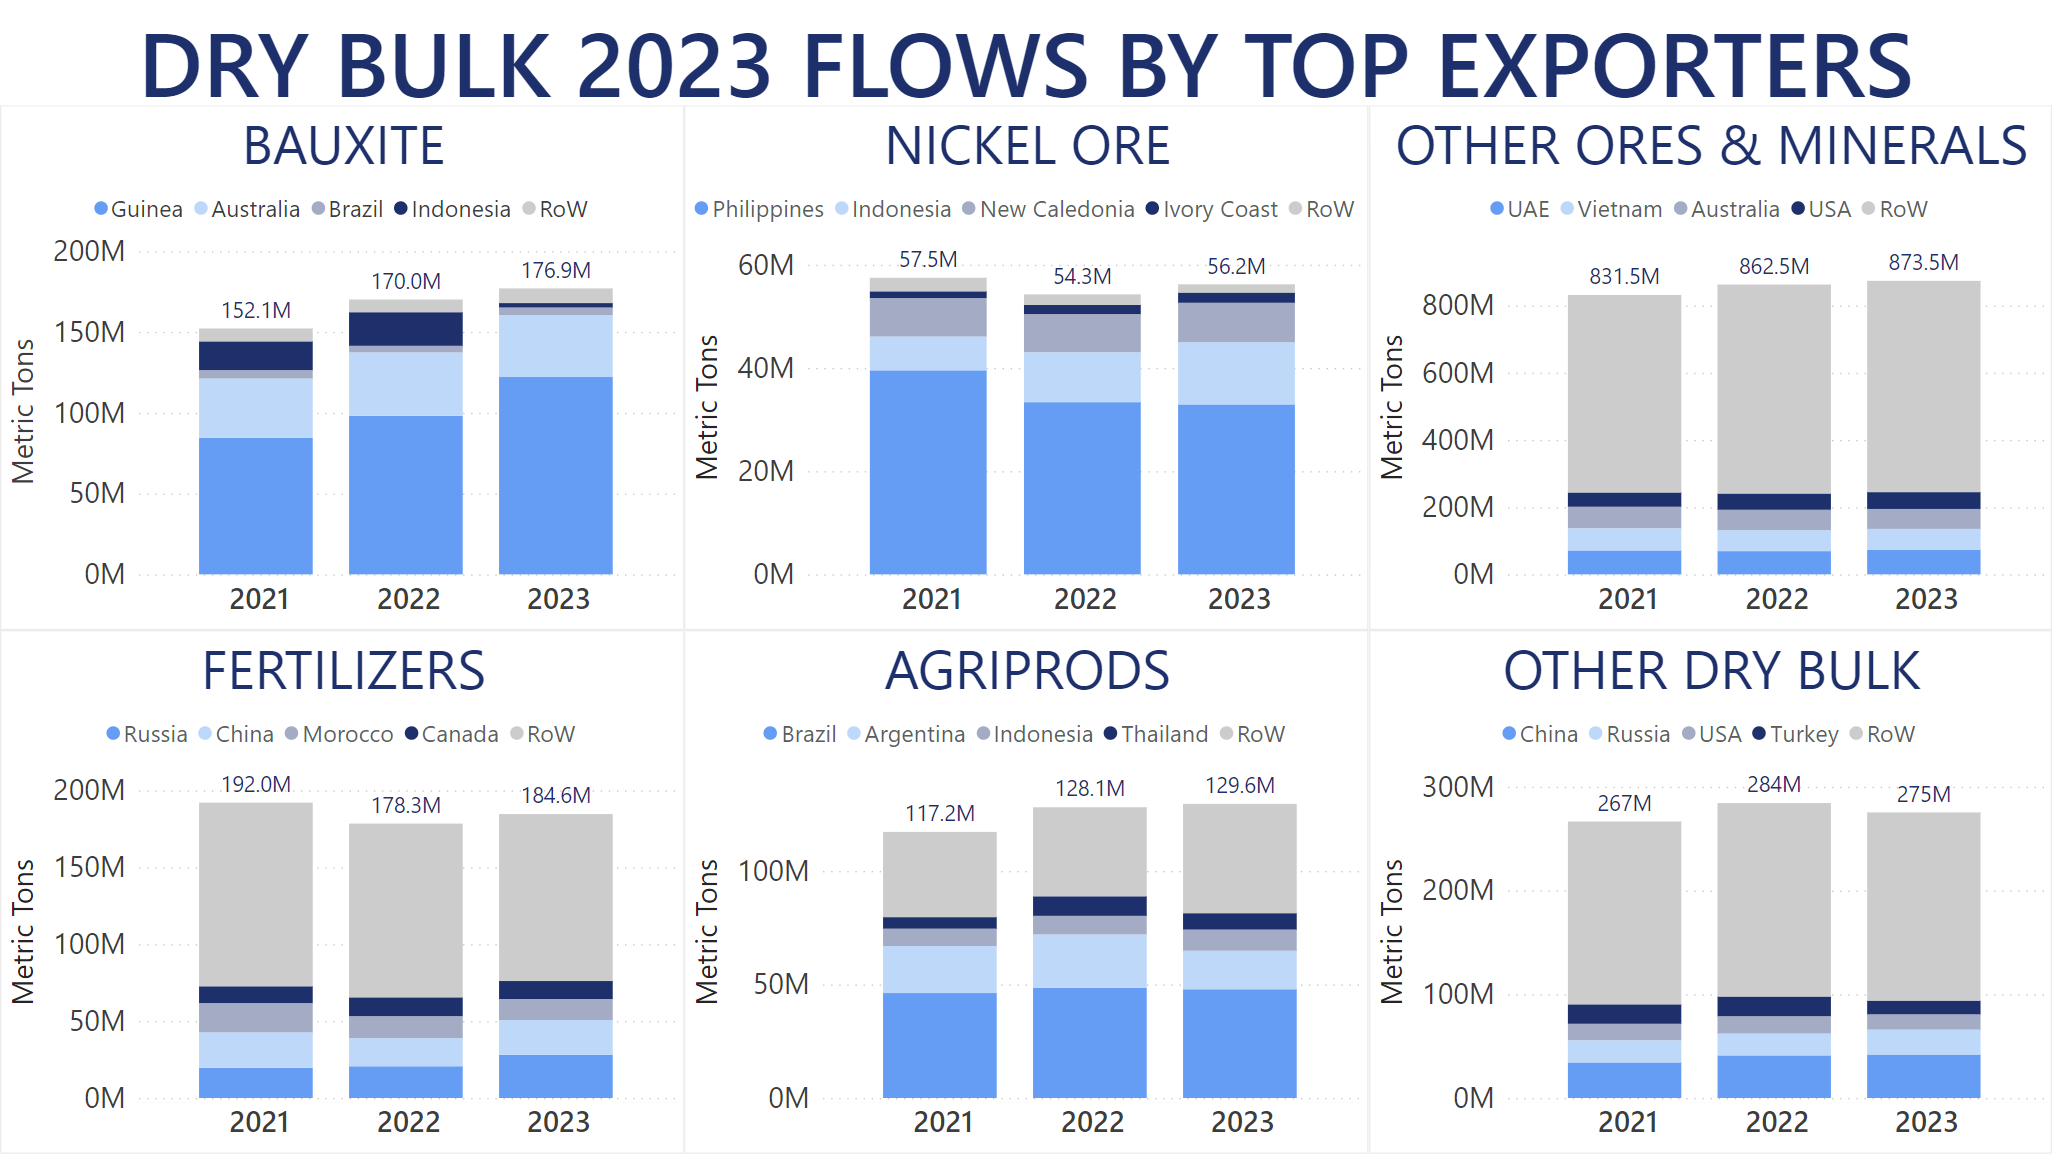
Bauxite quantities increased by 4% year-over-year in 2023, despite Indonesian exports tanking by over 86.7% compared to its 2022 levels. Guinea delivered over 122m MT of Bauxite worldwide for a 24.5% year-over-year gain. Australia's 38.3m MT translated into a 2.2% year-over-year decrease, while Brazil contributed to this market with over 4.6m MT of cargo for a 13.7% year-over-year boost.
The only Dry Bulk commodities to see a decrease in 2023 included Steels, Cement and Clinker, among others shipped in lower volumes, such as Salt, Sugar, Wood Chips, and Timber.
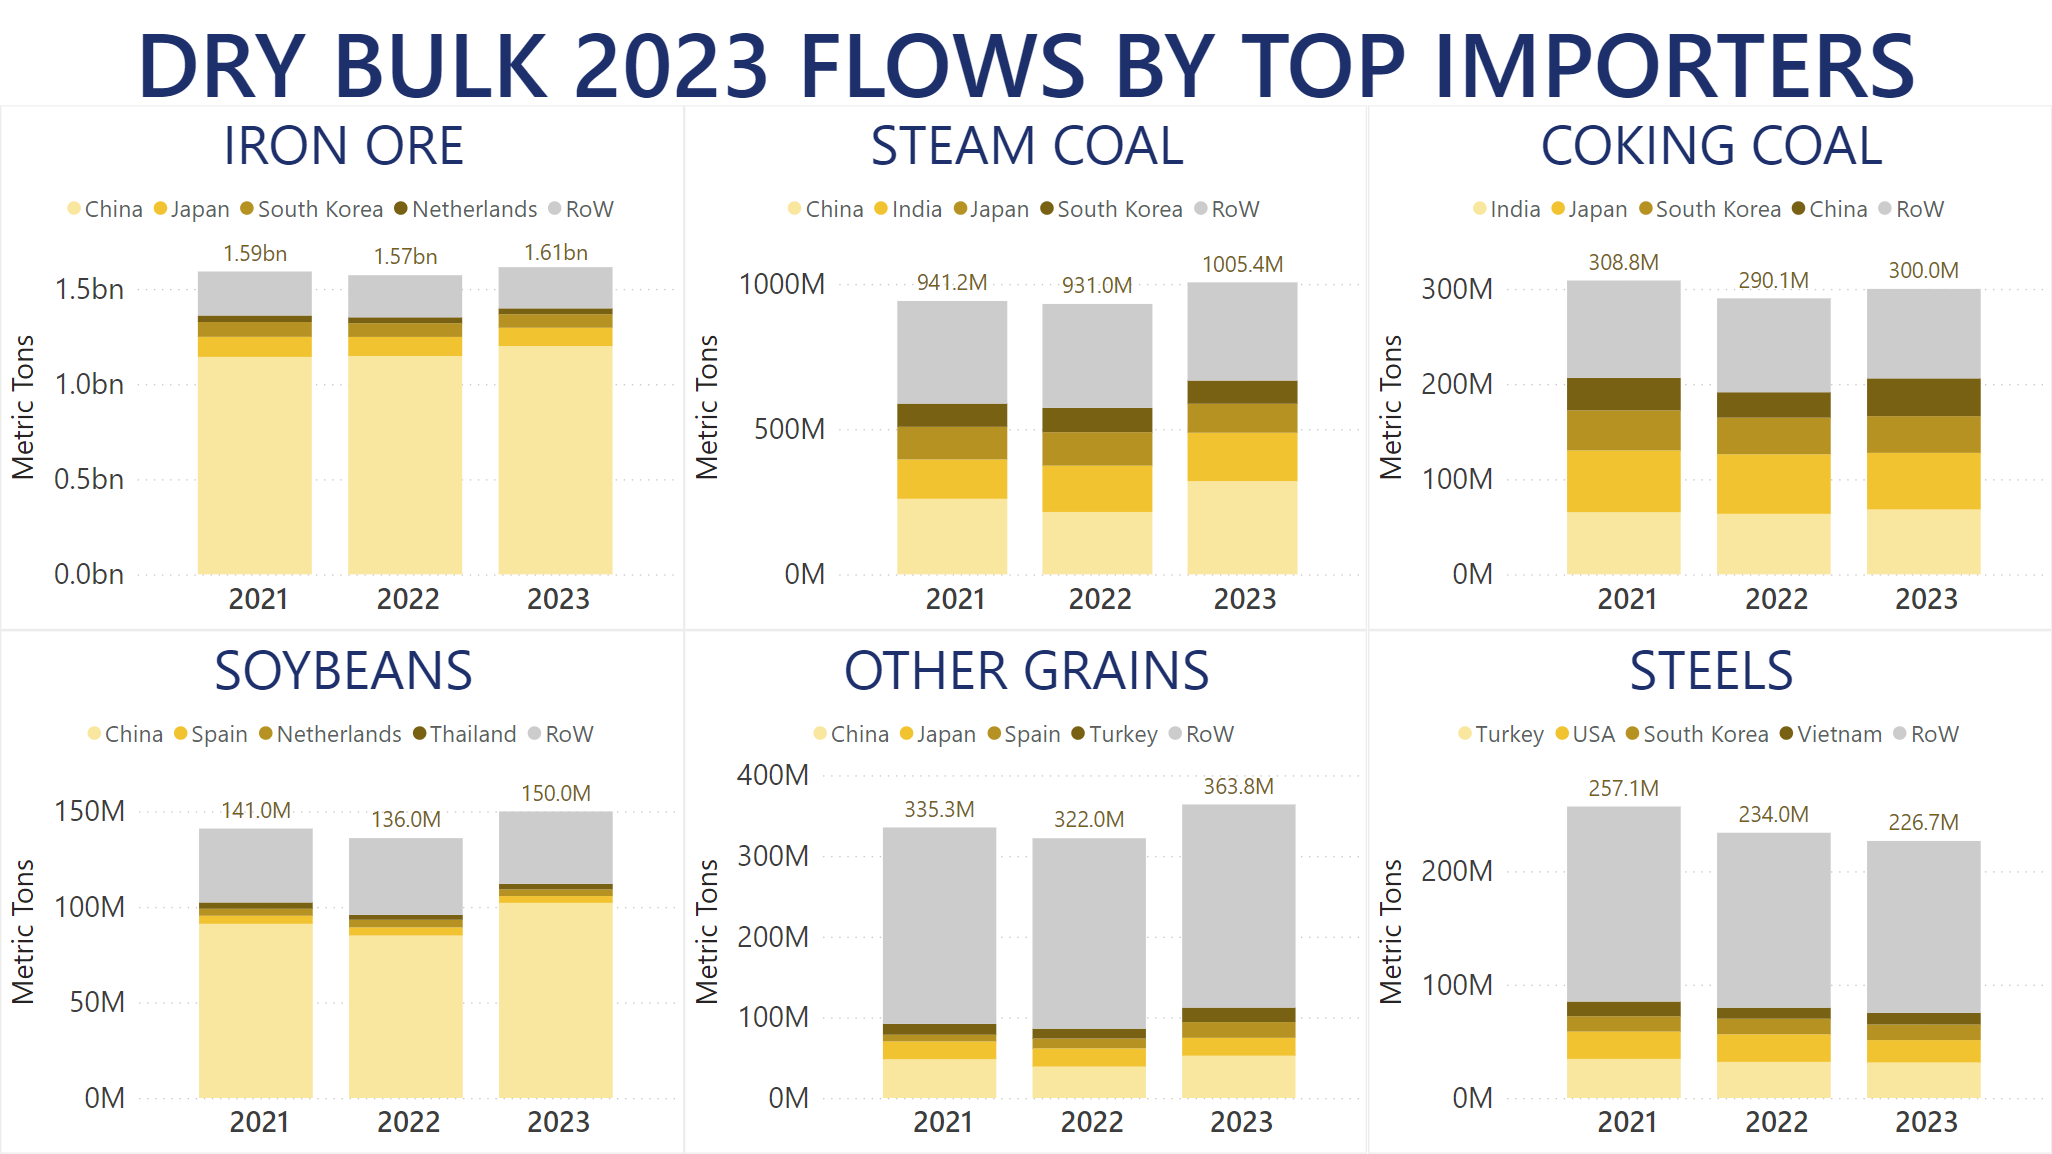
Demand-wise, overall Dry Bulk discharged in China exceeded 2.17bn MT in 2023 compared to less than 1.95bn MT in 2022, meaning that almost 40.5% of all voyages discharged in Chinese ports. As far as Iron Ore is concerned, China imported just under 1.2bn MT of cargo, for a 4.6% year-over-year increase. Nevertheless, demand from Japan dropped by 4.5% year-over-year, while South Korea imported 1.4% less Iron Ore than in 2022.
The trend in the Steam Coal market was almost the same, with Chinese imports totalling over 320.7m MT of cargo throughout 2023. Meanwhile, Japan and South Korea decreased their demand for seaborne Steam Coal by 13.4% and 4.4% year-over-year respectively.
In 2023, the top European importers of Soybeans, such as Spain and the Netherlands, decreased their demand for the commodity by 15.9% and 12.8%, respectively. Yet, China with its 68.1% market share was the trend setter. The largest importer of Soybeans discharged just over 102.1m MT – the highest quantity ever imported – for a 20.1% year-over-year gain.
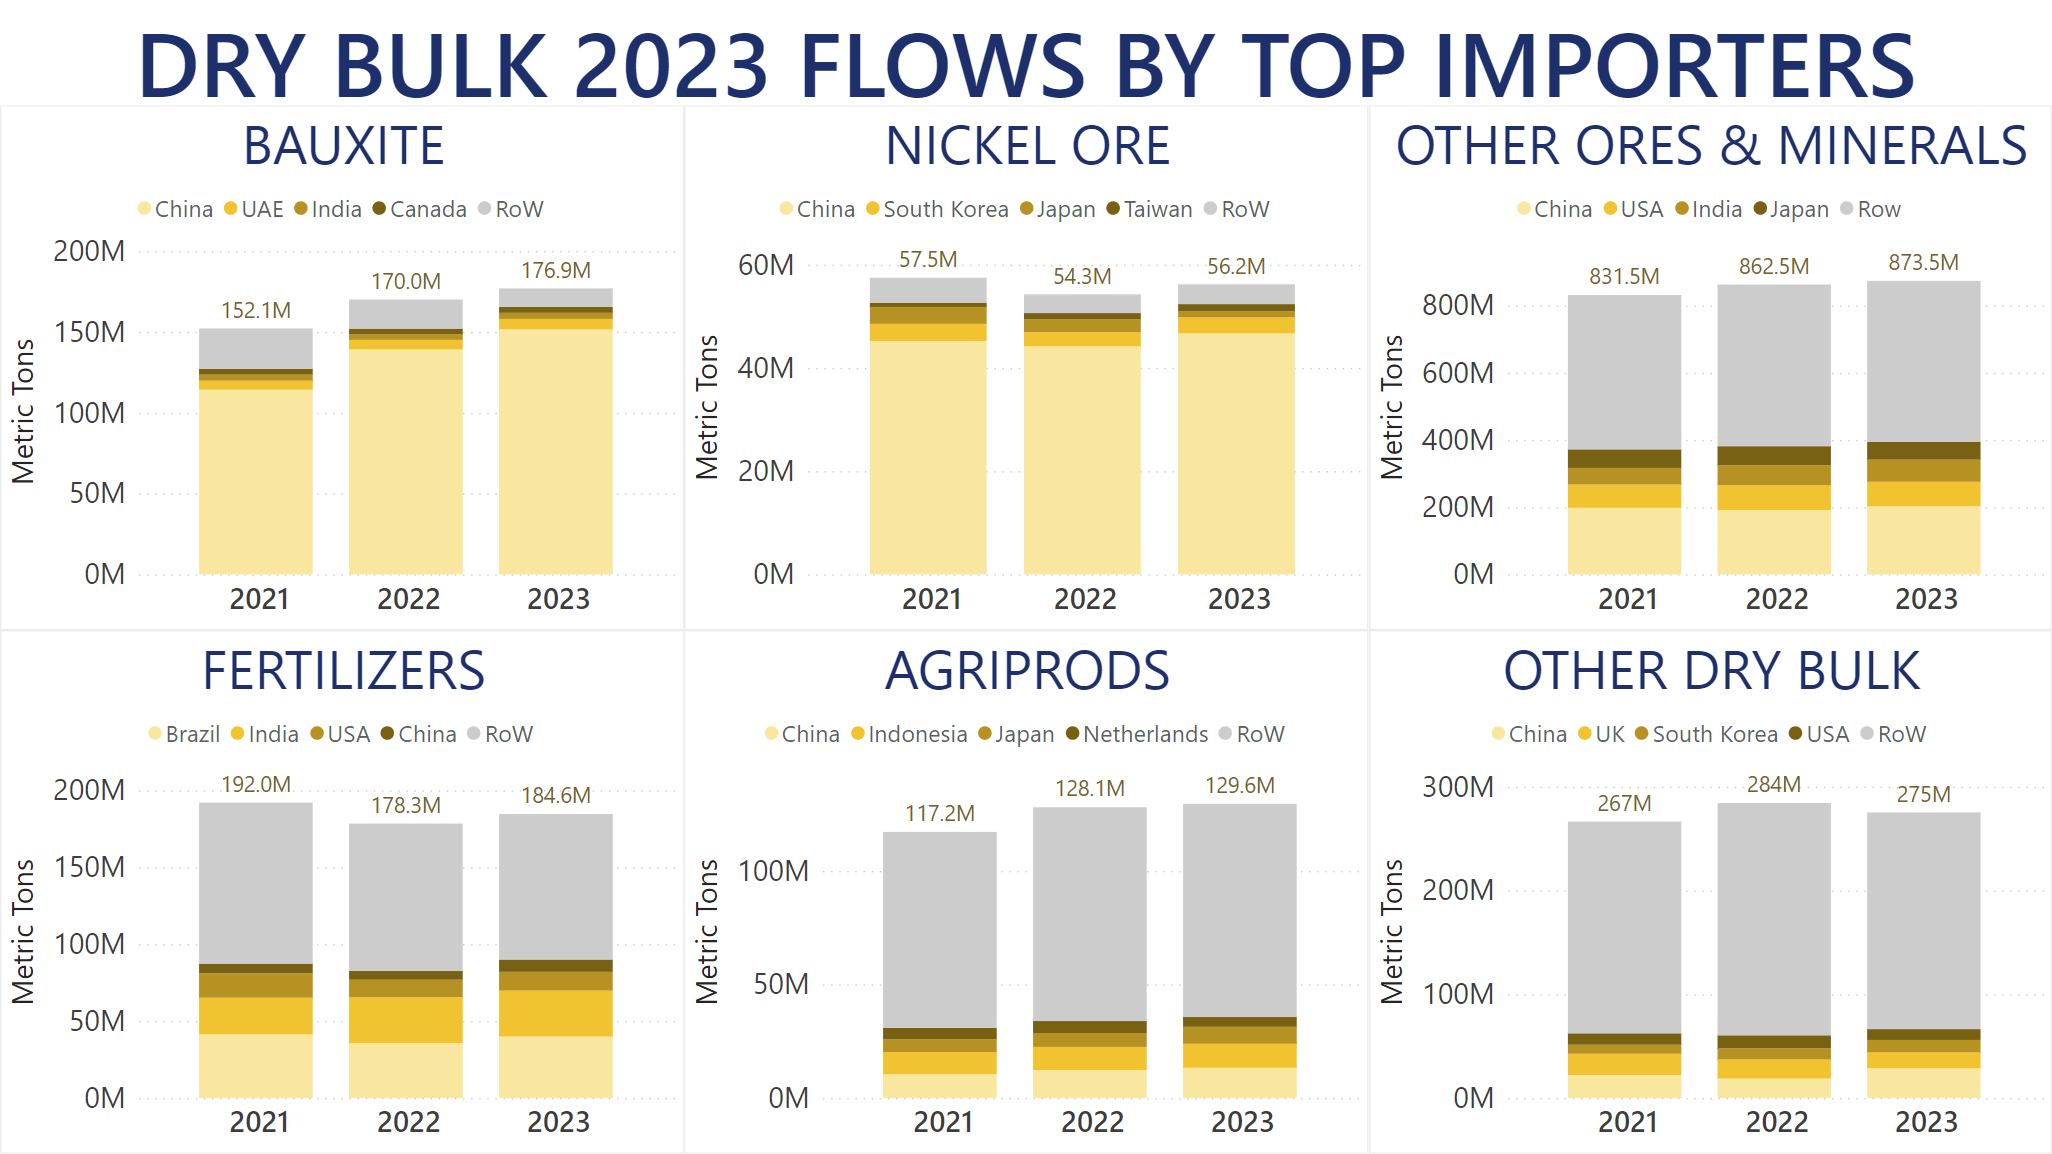
Chinese imports of Bauxite in 2022 surpassed 151.5m MT for a 8.9% year-over-year boost. Other countries' demand for the commodity also increased, with the UAE and India importing 9.4% and 12.5% more on a year-over-year basis, respectively.
In the Nickel Ore market, Taiwan overtook Japan for the Top 3 spot in quantities imported throughout 2023, after increasing discharges at its ports by 11.8% year-over-year. With China and South Korea boosting their imports of this commodity by 5.7% and 14.3% year-over-year respectively, Nickel Ore quantities shipped by vessel increased by nearly 3.6% overall in 2023.
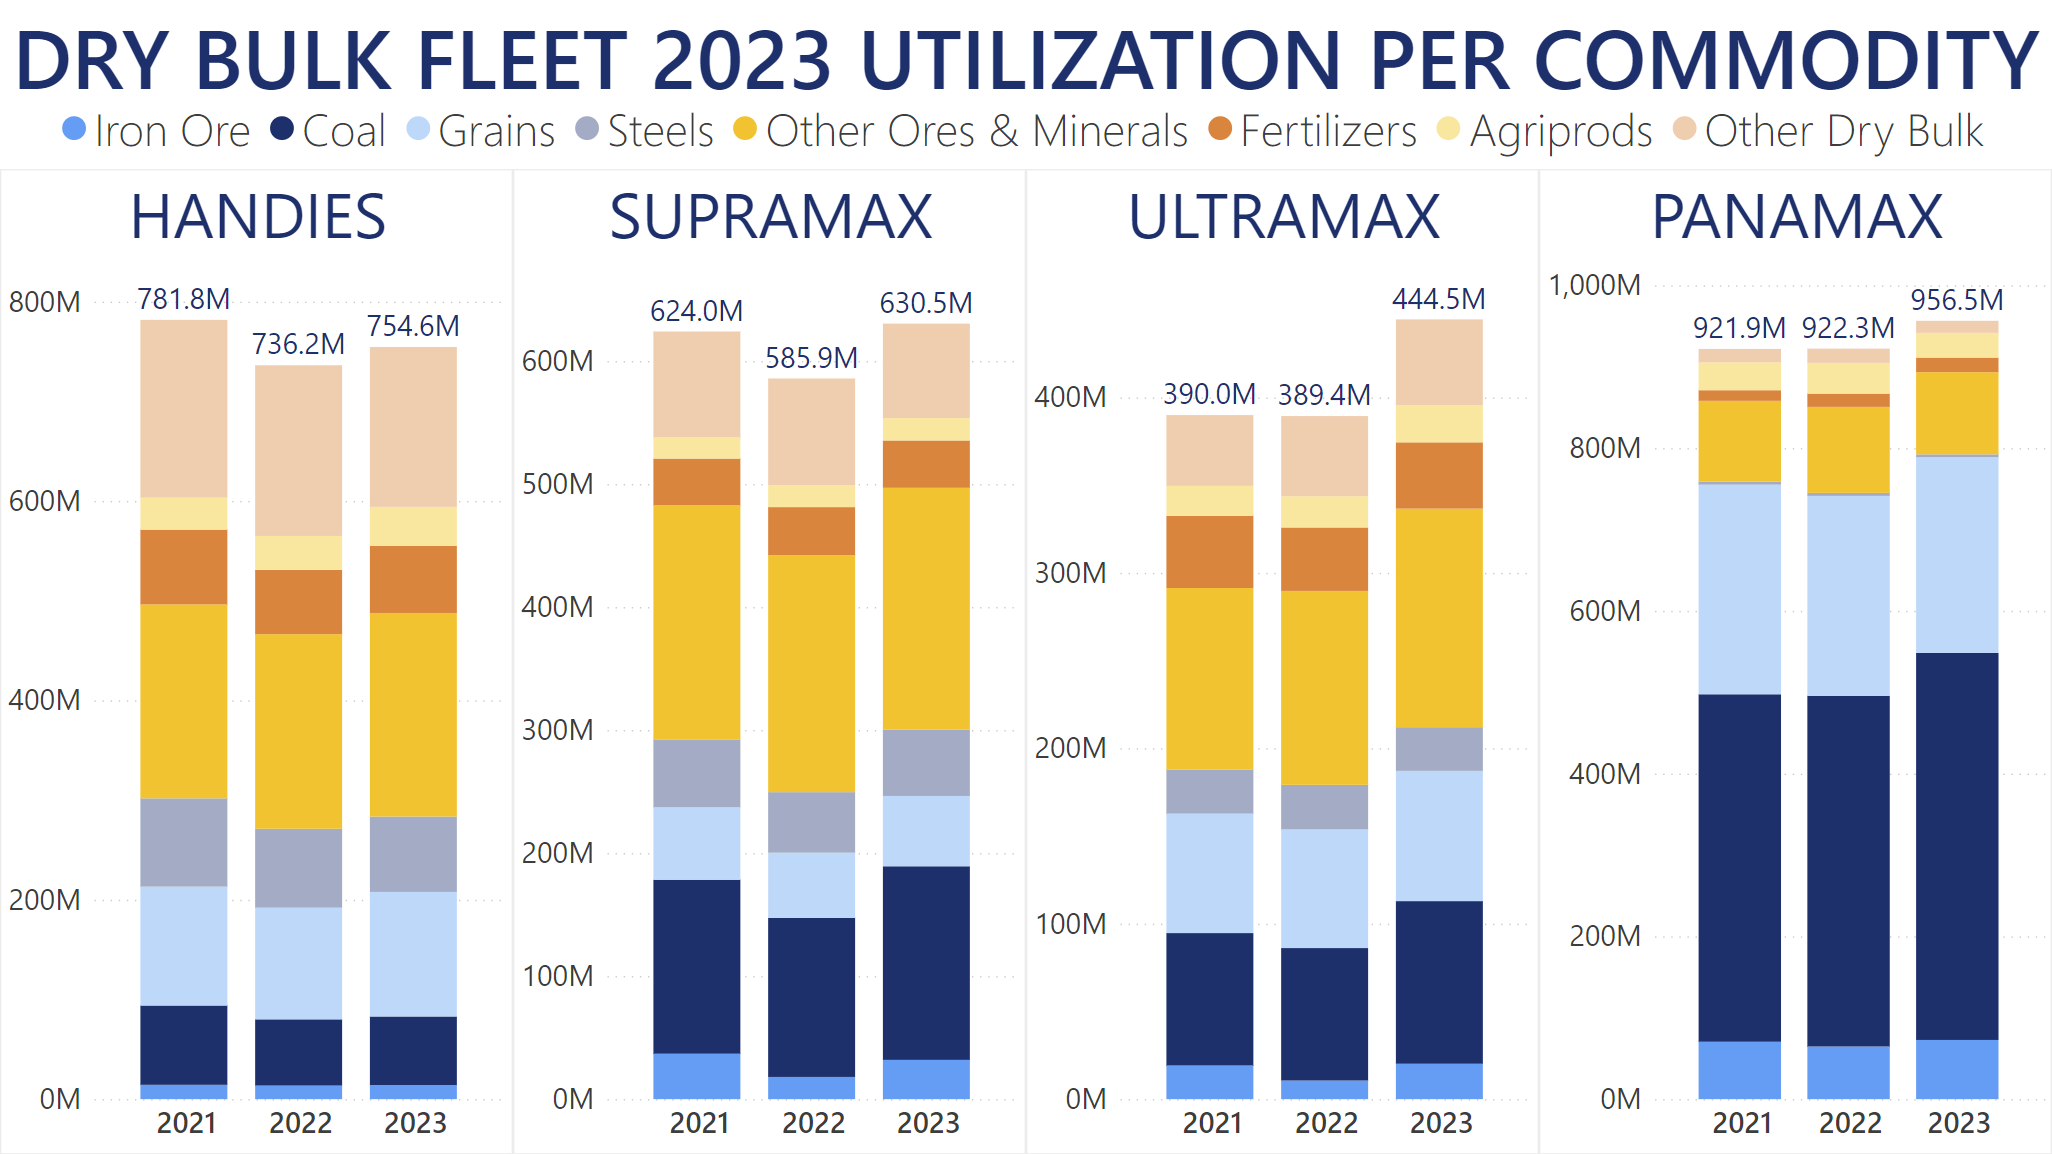
Fleet utilization by vessel size in 2023 increased across almost all segments. Handysize and Handymax vessels up to 50K MT of deadweight combined carried 18.4m MT more cargo for a 2.5% year-over-year boost. The two smallest fleet segments experienced the most increase in quantities transported in the Grains market.
Supramaxes between 50K and 60K MT of deadweight transported over 630m MT of cargo for a 7.6% year-over-year increase. The vessels in this segment carried 21.7% more Coal in 2023 than they had transported in 2022. Their use in the Iron Ore, Grains and Steels markets was also increased by between 9.4% and 76.8% year-over-year.
The biggest year-over-year increase in 2023 saw the Ultramax fleet segment between 60K MT and 68K MT of deadweight carry 14.2% more Dry Bulk cargoes last year than they had done in 2022. As with the Supramax segment, the biggest boost for these vessels came from the Coal and other Ores/Minerals markets.
Panamax vessels between 68K and 85K MT of deadweight saw a 3.7% positive shift in their utilization against to 2022 levels, having carried over 956m MT of Dry Bulk. The largest portions of this were voyages carrying Steam Coal at over 370.8m MT and Soybeans at over 111.2m MT.
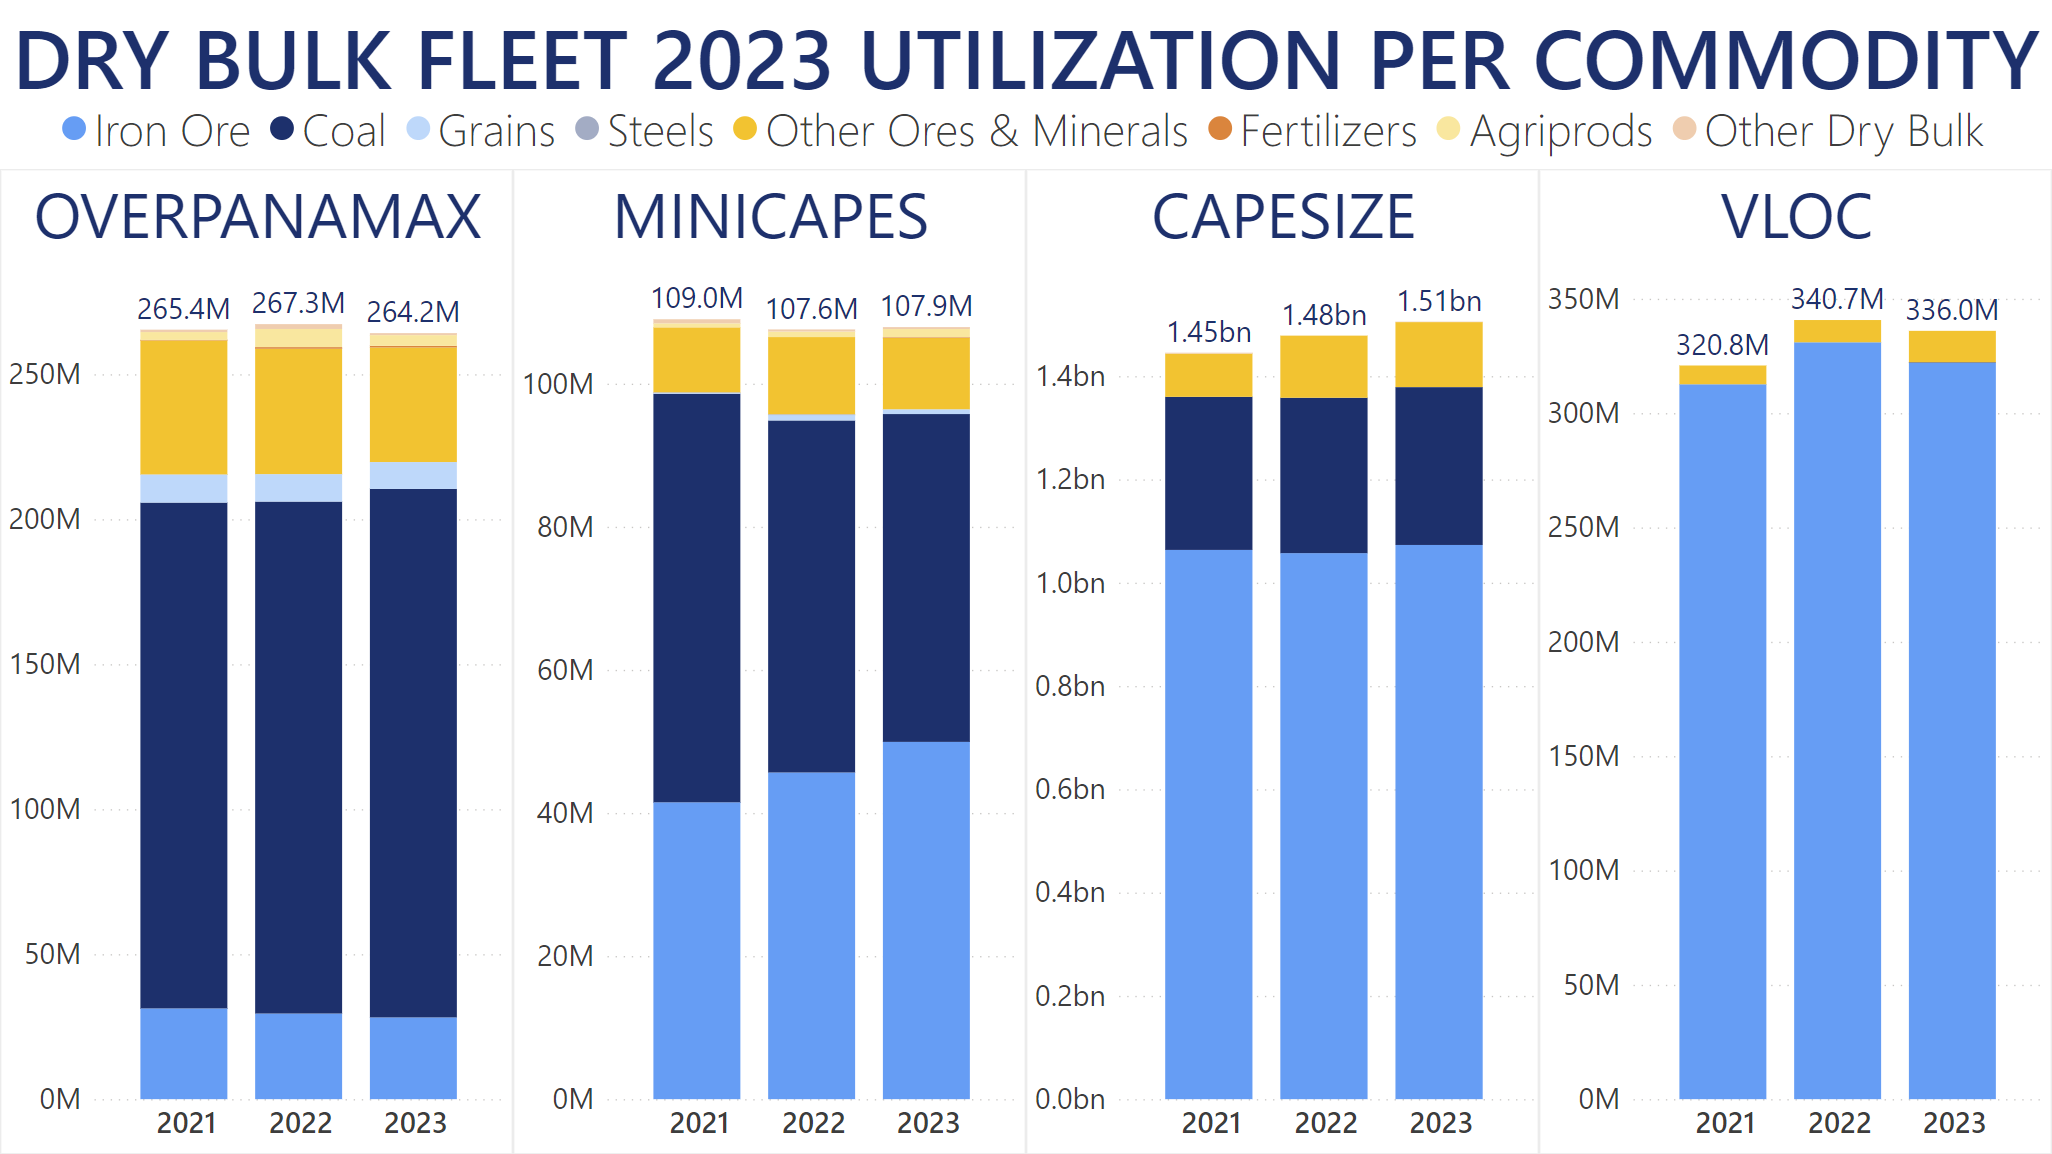
OverPanamax vessels between 85K and 100K MT of deadweight are one of the fleet categories to see less utilization in 2023. Having carried a total of less than 264.3m MT of Dry Bulk commodities throughout 2023, this translated into a 1.2% year-over-year decrease. The only other fleet segment to see less demand last year were the VLOCs with their 1.4% year-over-year drop.
Traditionally, Capesize vessels between 120K MT and 220K MT of deadweight carried the most Dry Bulk in 2023, with their combined shipments totalling just over 1.5bn MT for a 2% year-over-year boost. The majority of these voyages included over 1.07bn MT of Iron Ore transported worldwide. A 1.5% year-over-year increase for this specific commodity, it gave Capes a 66.5% market share in the Iron Ore market. Minicapes between 100K and 120K MT of deadweight also saw an increase in Iron Ore cargoes for their voyages, while Coal was carried less commonly on board in 2023.
Our Trade Flows tool allows you to follow each commodity, importer, exporter, fleet segment, and a lot more. You can gain accurate intelligence on a macro- and micro-level for the entire shipping industry. Book a demo below to see everything Trade Flows can do for you.