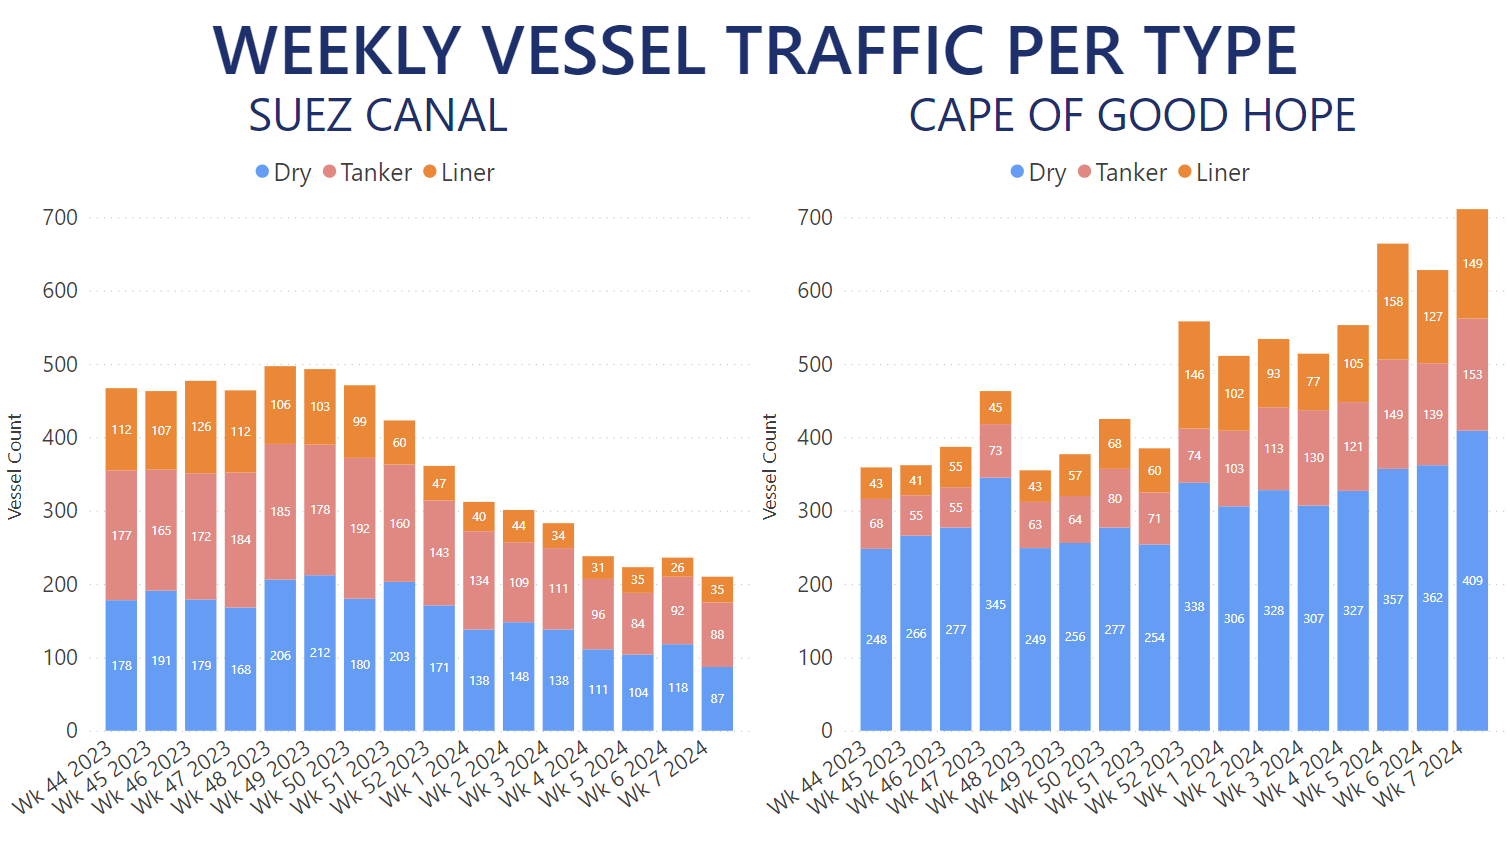
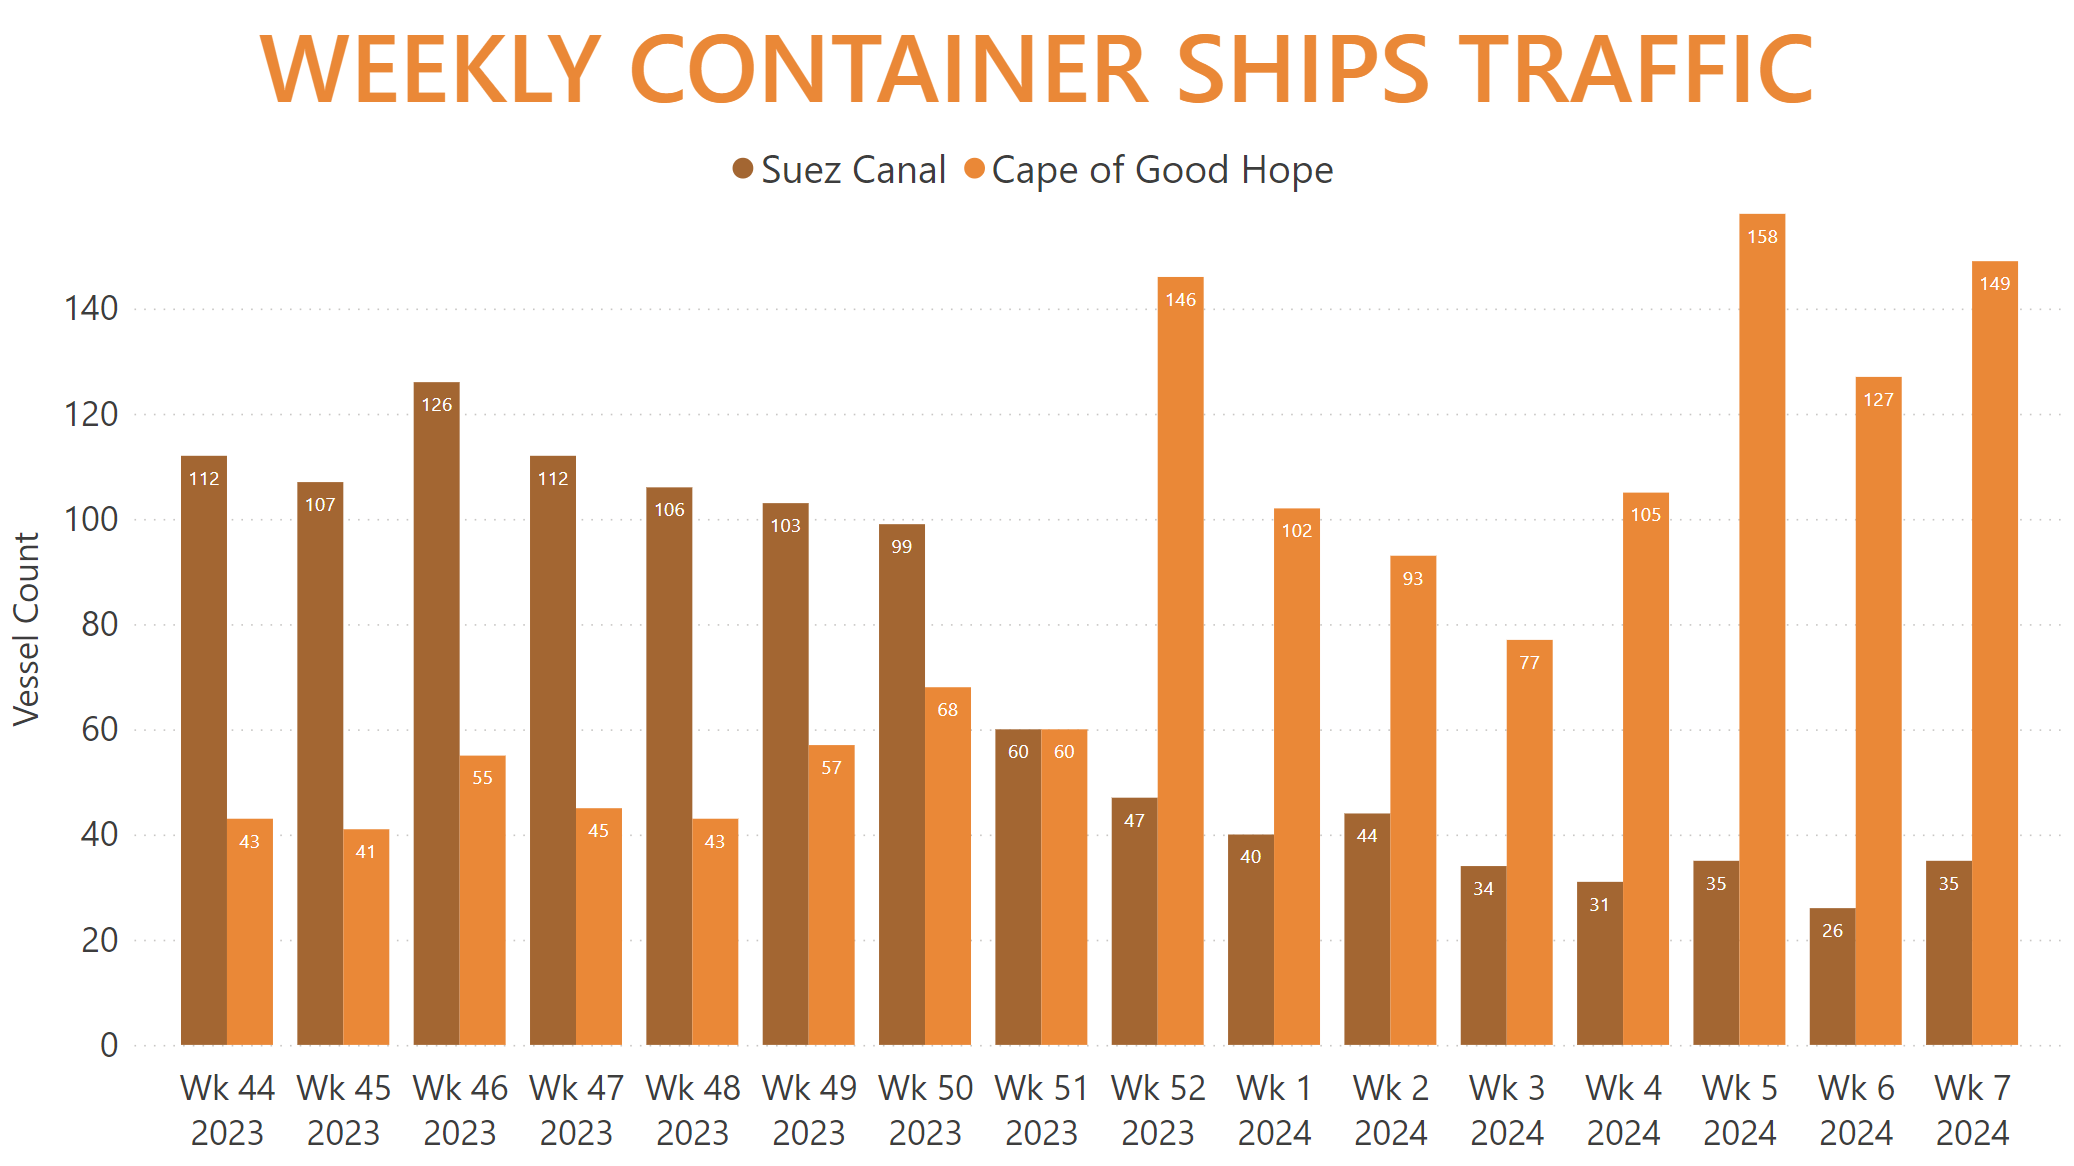
Four months after what is officially considered to be the start of the Red Sea crisis, overall merchant vessel traffic through the Suez Canal has dropped by about 55% on a weekly basis. At the same time Dry Bulkers, Tankers (including Gas Carriers) and Container Ships passing via the Cape of Good Hope increased in count by up to 98%. AXSInsights data shows the different effects the crisis has had on the three main vessel markets. While Liner vessel traffic reflected the events in the Bab al-Mandab Strait as early as November last year, Dry Bulker and Tanker vessel counts through the Suez Canal were affected a couple of weeks later.
Container Ships in particular saw the heaviest drop in traffic through the Canal, with the second week of February seeing only 26 vessels crossing in either direction. This was a historic low, which during the last decade was only seen once when the MV EVER GIVEN obstructed the Suez Canal in 2021. It also represented a 76.1% year-over-year decrease, compounding the already heavy 64.4% year-over-year drop in Container Ship traffic registered throughout January.
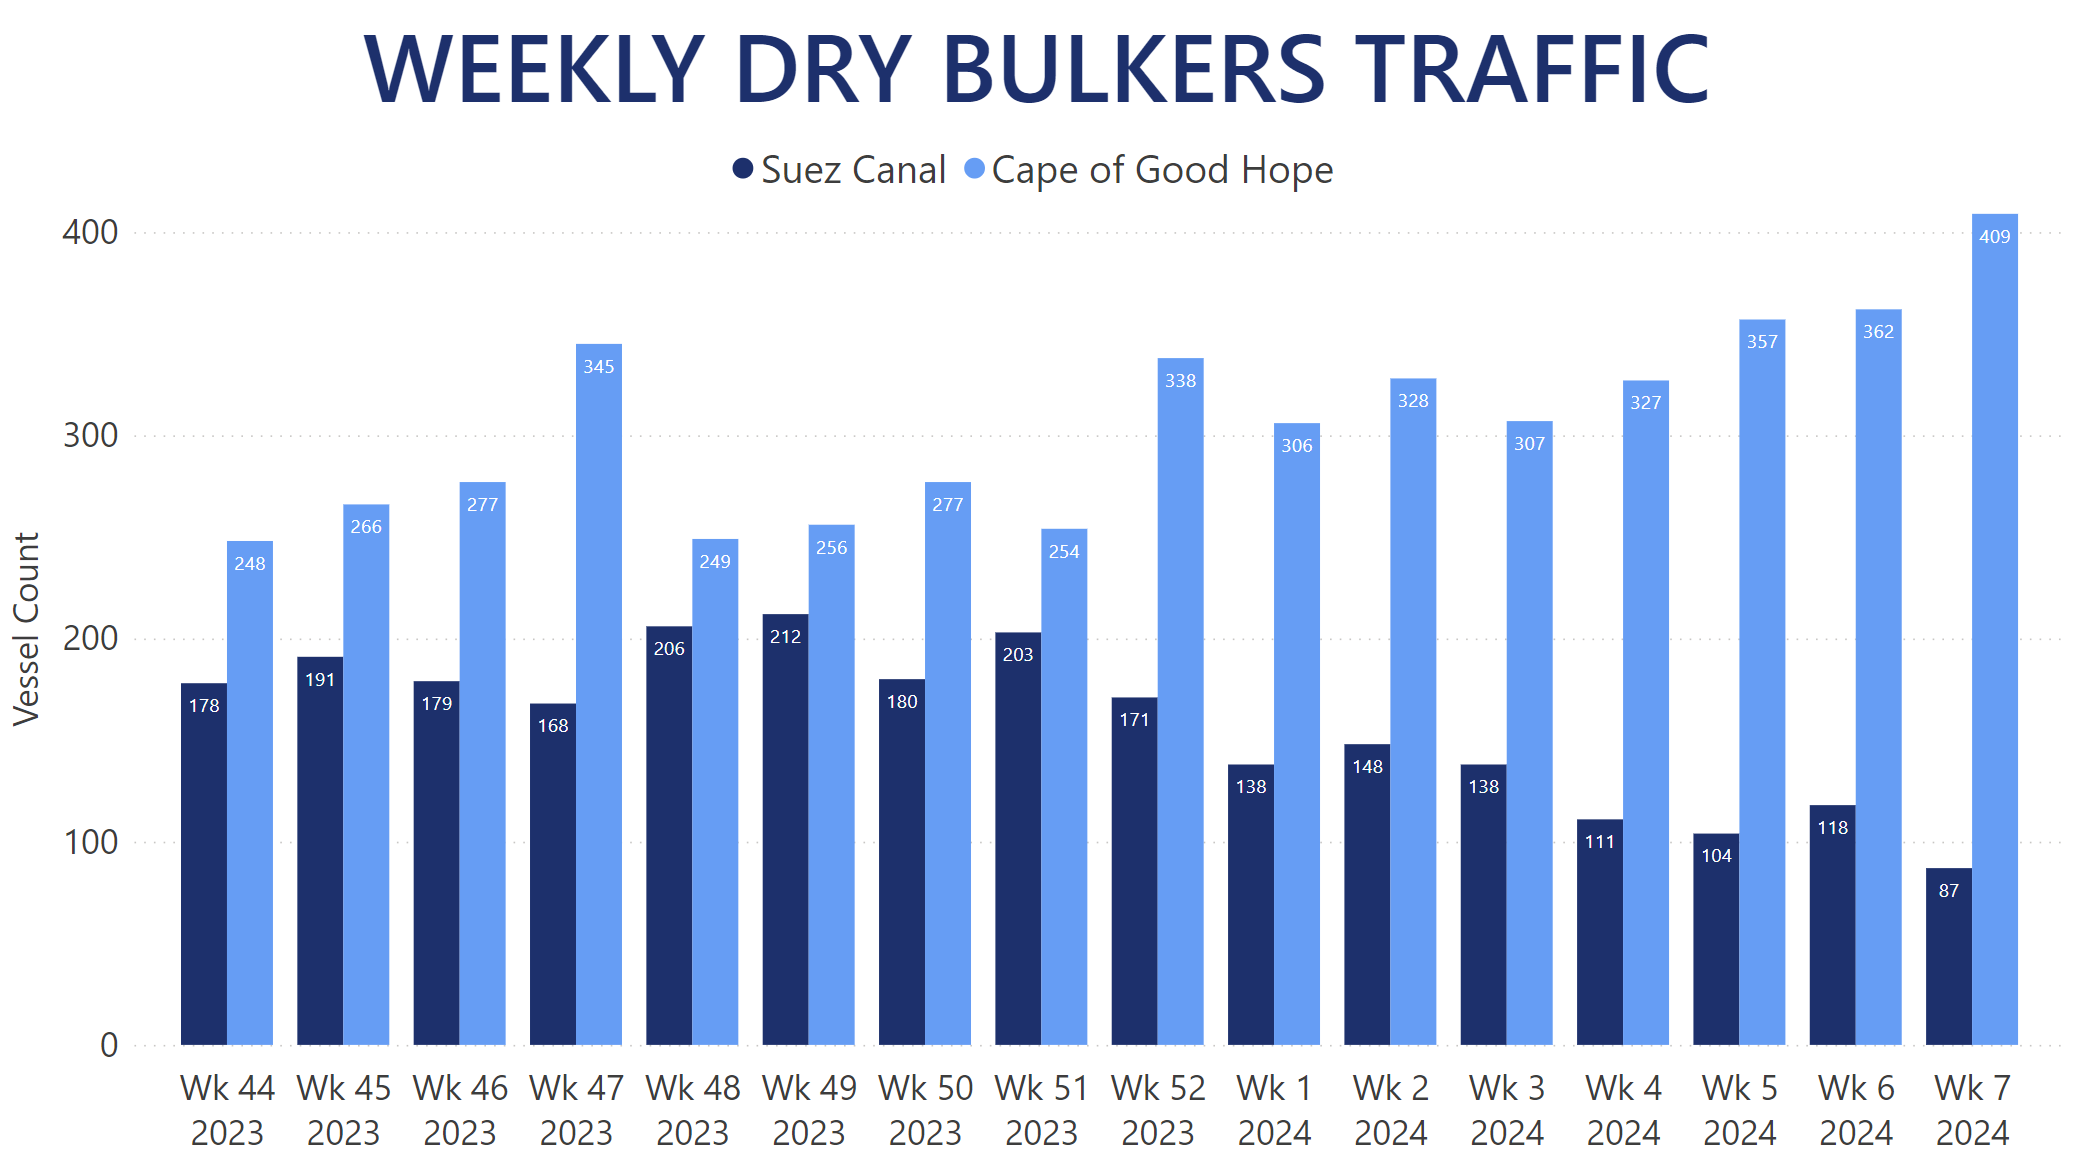
Percentage-wise, the Dry Bulk segment appears to be the least affected by the Red Sea crisis. While Container Ships were already scrambling for the Cape of Good Hope, vessels carrying Dry Bulk cargo hit a record count of 212 crossing the Suez Canal during the first week of December 2023, with traffic remaining strong throughout the entire month. In January 2024, however, Dry Bulkers traversing the Canal dropped by 18.4% year-over-year. Traffic dropped even more significantly in the first weeks of February by over 55% year-over-year.
The relatively slow response of this market segment could be explained by the fact that the most commonly carried Dry Bulk commodity – Iron Ore – is most prolifically shipped to China either from Australia, or in second place Brazil by vessels routing via the Cape of Good Hope anyway. Furthermore, compared to Tankers and Container Ships, Dry Bulkers are the only fleet segment which traditionally sees more vessels pass via the Cape as opposed to the Suez Canal. That being said, the increase in traffic around the southernmost point of Africa currently measures at over 120.4% year-over-year since the start of 2024.
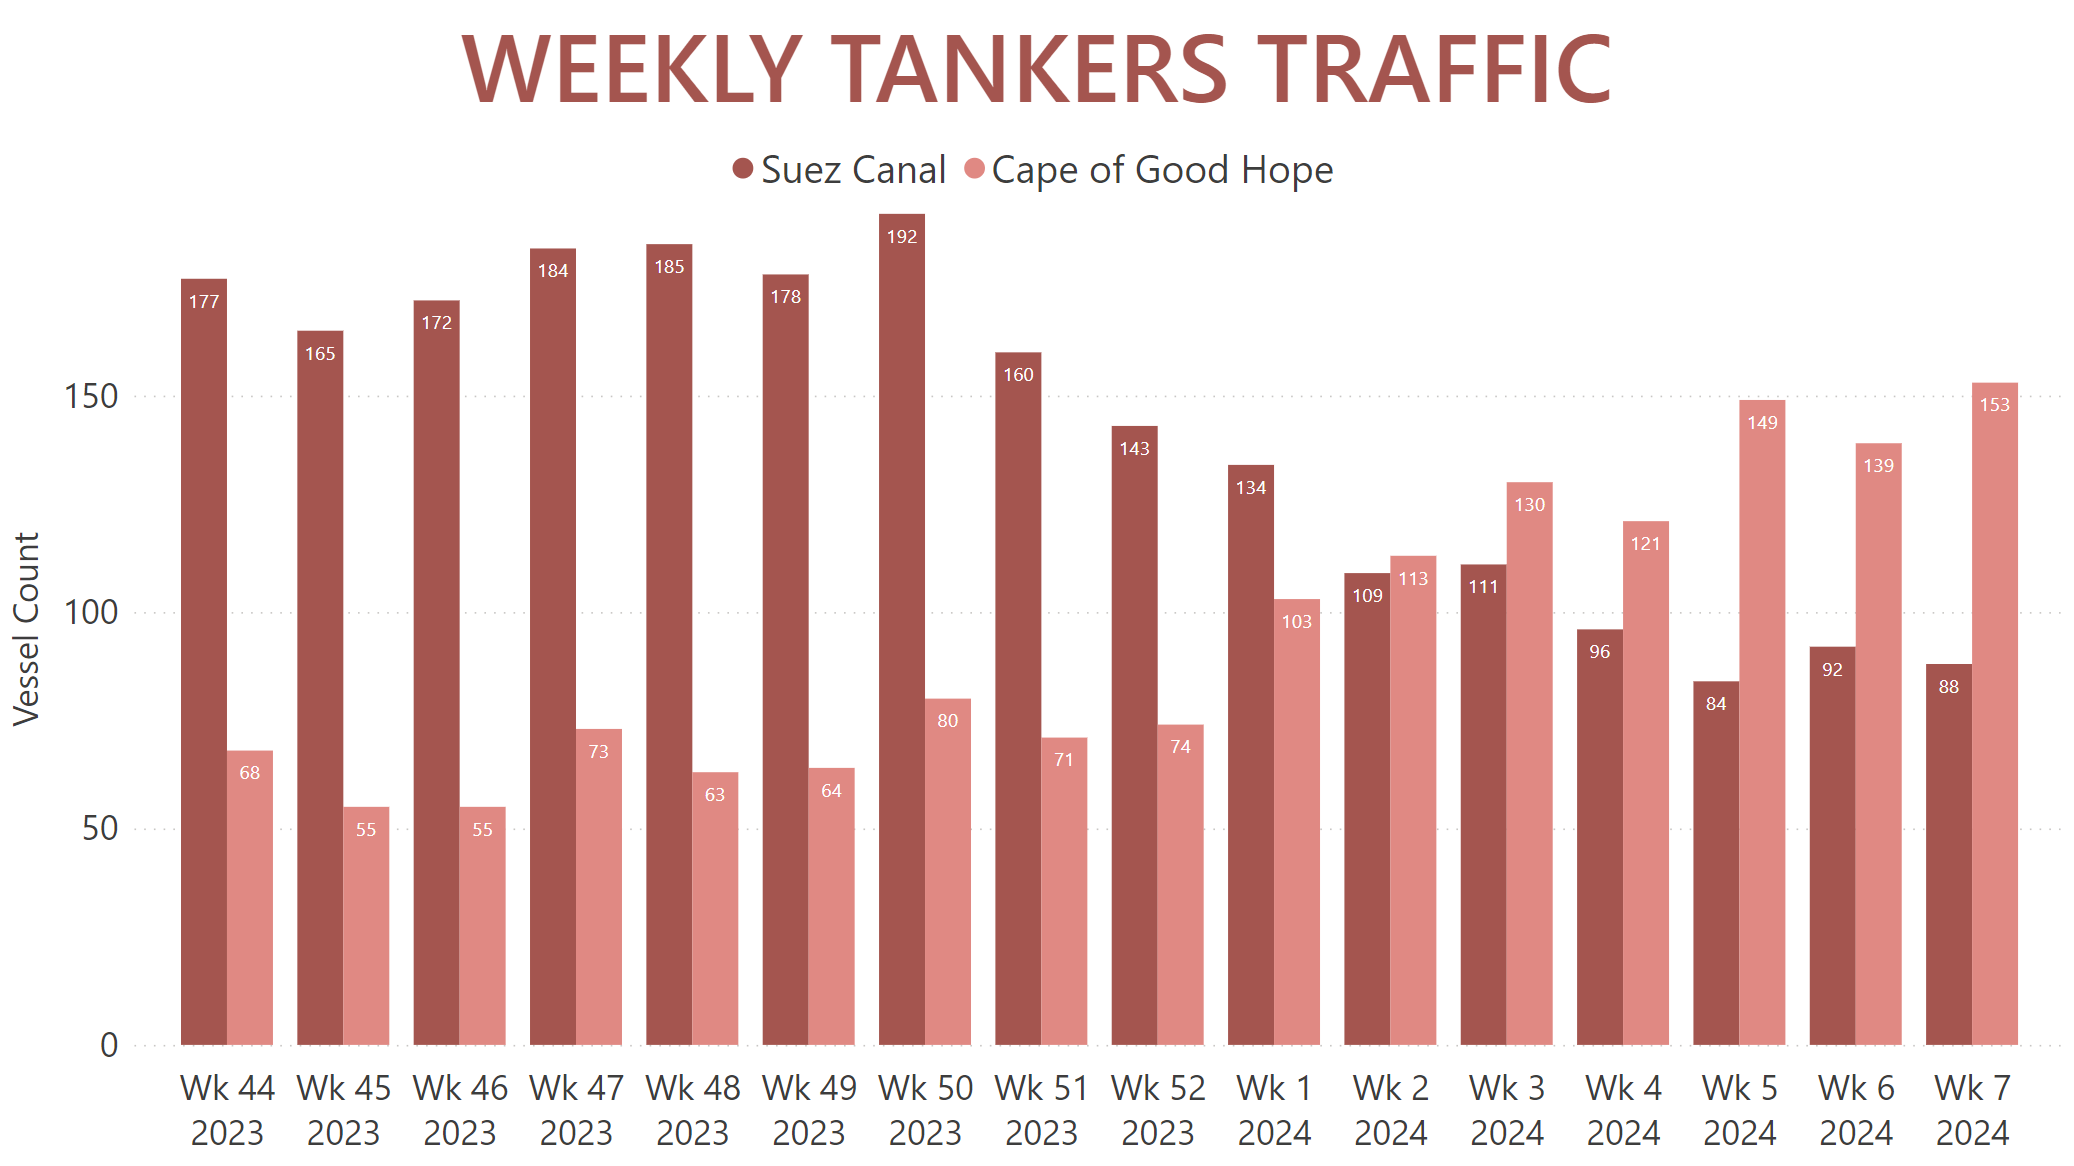
Tanker vessels, including LNG and LPG carriers, also kept a steady flow through the Suez Canal through mid-December of last year, when up to 192 ships could be observed traversing its waters in a single week. Consequently, over the past nine weeks Tanker traffic has dwindled by over 55%, with just over 80 vessels crossing the Suez in the first week of February. Overall traffic throughout January registered a 35.2% year-over-year drop, almost completely wiping out the increase previously observed in the aftermath of Russia's 2022 full-scale invasion of Ukraine.
At the same time, rerouting Tankers increased the passages around the Cape of Good Hope to a peak of over 150 vessels recorded just last week. We're technically excluding VLCCs from this count, as they cannot traverse the Suez Canal in a fully laden condition and would thus skew the observed stats. That being said, the largest Tankers in the ocean do add a further 30 to 50 vessels per week to the overall traffic via the Cape of Good Hope.
Container Ships were heavily affected by the Red Sea crisis, since some of the global corridors in liner shipping cross that region. The Asia-Europe, Asia-Med and some of the Asia-USEC lines are being rerouted.
Furthermore, while Dry Bulk and Tanker cargoes are entirely owned by the operators, Container Ship operators move cargoes for hundreds of different clients, thus increasing the responsibility and risk associated with their voyages.
The first observable decrease in weekly passages of the Canal for this segment occurred in the last weeks of November 2023. In total, weekly Container Ship traffic through the Suez Canal has decreased by almost 80% over the past thirteen weeks.
Conversely, over 115 vessels in this segment have passed via the Cape of Good Hope per weedek on average since the beginning of 2024. At its peak so far, Container Ship traffic via the Cape totalled nearly 160 vessels in the first week of February – a 222.4% increase over the weekly average preceding the R Sea crisis.
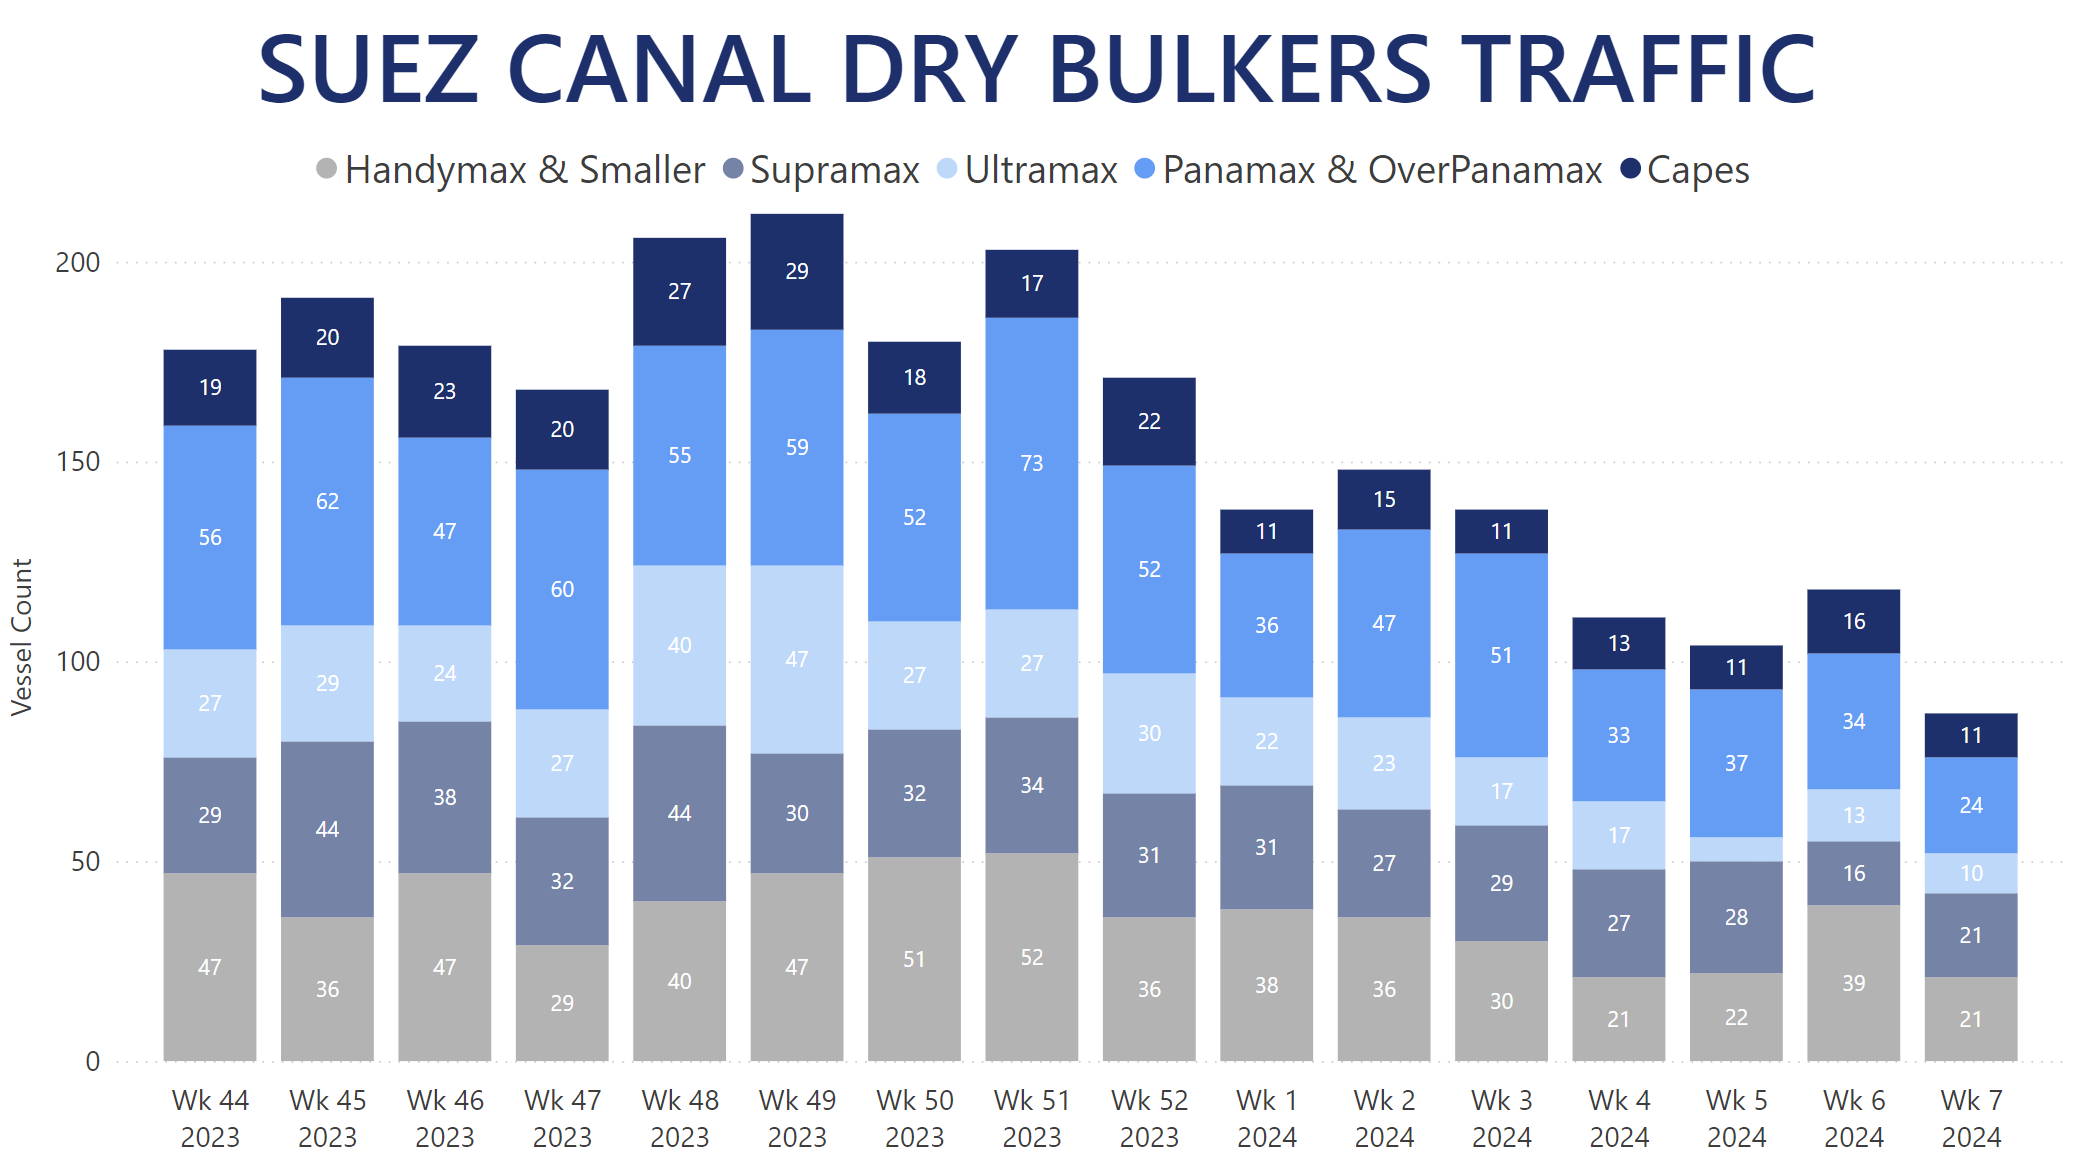
Delving down into individual fleet categories, Dry Bulkers of all sizes were seen avoiding the Suez Canal for the Cape of Good Hope to varying degree. Capesize vessels between 100K and 200K MT of deadweight have been the least affected Dry Bulk segment so far. This is, of course, due to them crossing the Suez Canal the least frequently when compared to smaller Dry Bulkers. That being said, throughout January 2024, 56 Capes in total crossed the Canal – a 42.8% year-over-year decrease.
Ultramax Dry Bulkers between 60K and 68K MT of deadweight appear to have seen the most noticeable percentage-wise decrease in traffic through the Suez Canal, with only 6 vessels of this category traversing its waters during the first week of February.
Panamax and OverPanamax vessels between 68K and 100K MT of deadweight traversing the Suez Canal have decreased from the 50-60 per week range to less than 40 vessels over the last three weeks. Last week alone saw just 24 ships from this category cross the Canal. Curiously, the Supramax fleet between 50K and 60K MT of deadweight actually recorded a year-over-year increase of 21.2% in vessels traversing the Suez Canal in January.
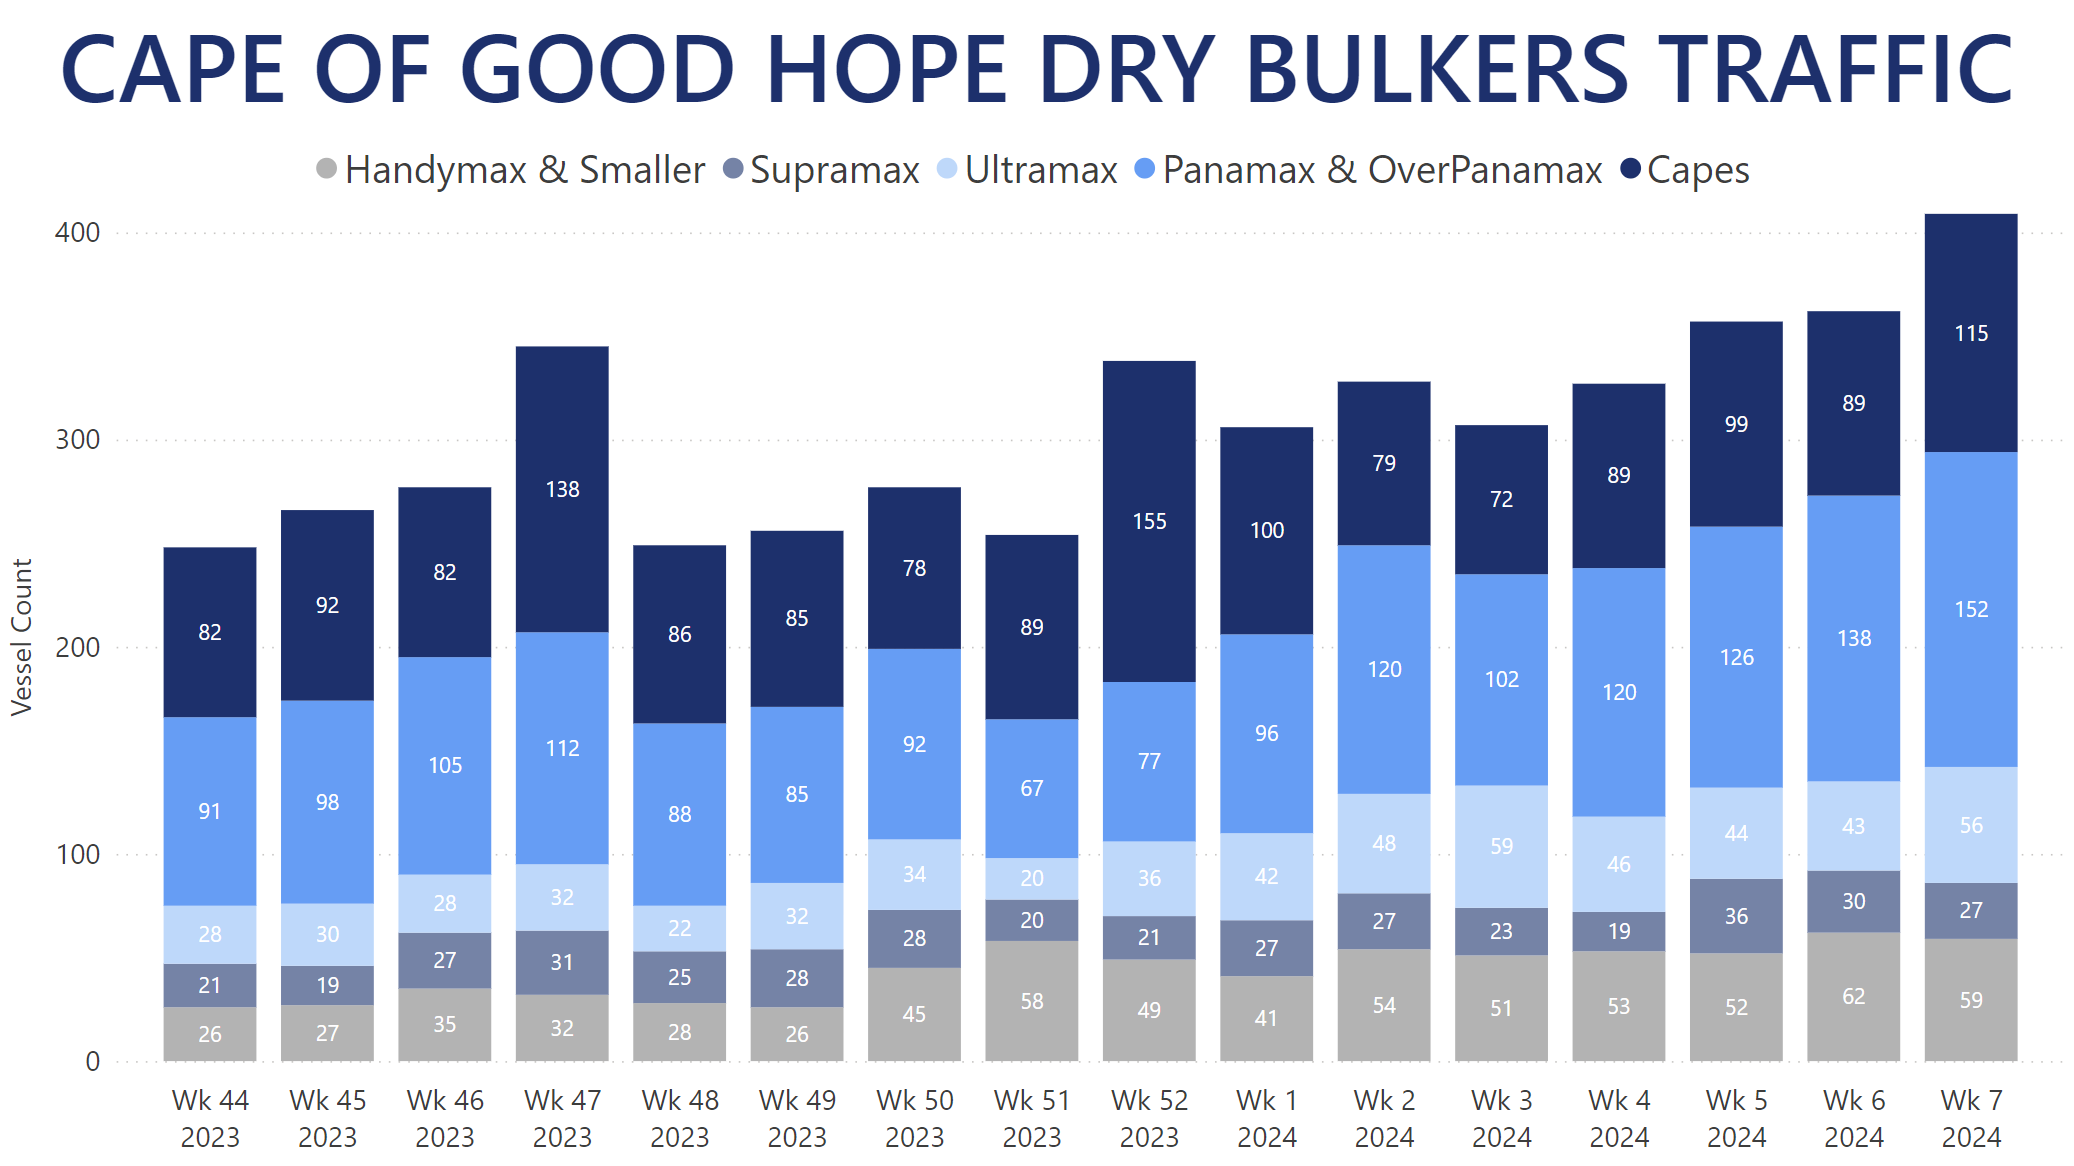
Dry Bulkers passing the Cape of Good Hope mirror the trend of the Suez Canal traffic. Ultramax passages via the Cape of Good Hope per week have nearly doubled since the start of 2024, while Panamaxes and OverPanamaxes counts have gone from 90-100 before the crisis began to a peak of 152 vessels registered just last week. The Supramax Dry Bulkers have the least observable increase in passages via the Cape of Good Hope.
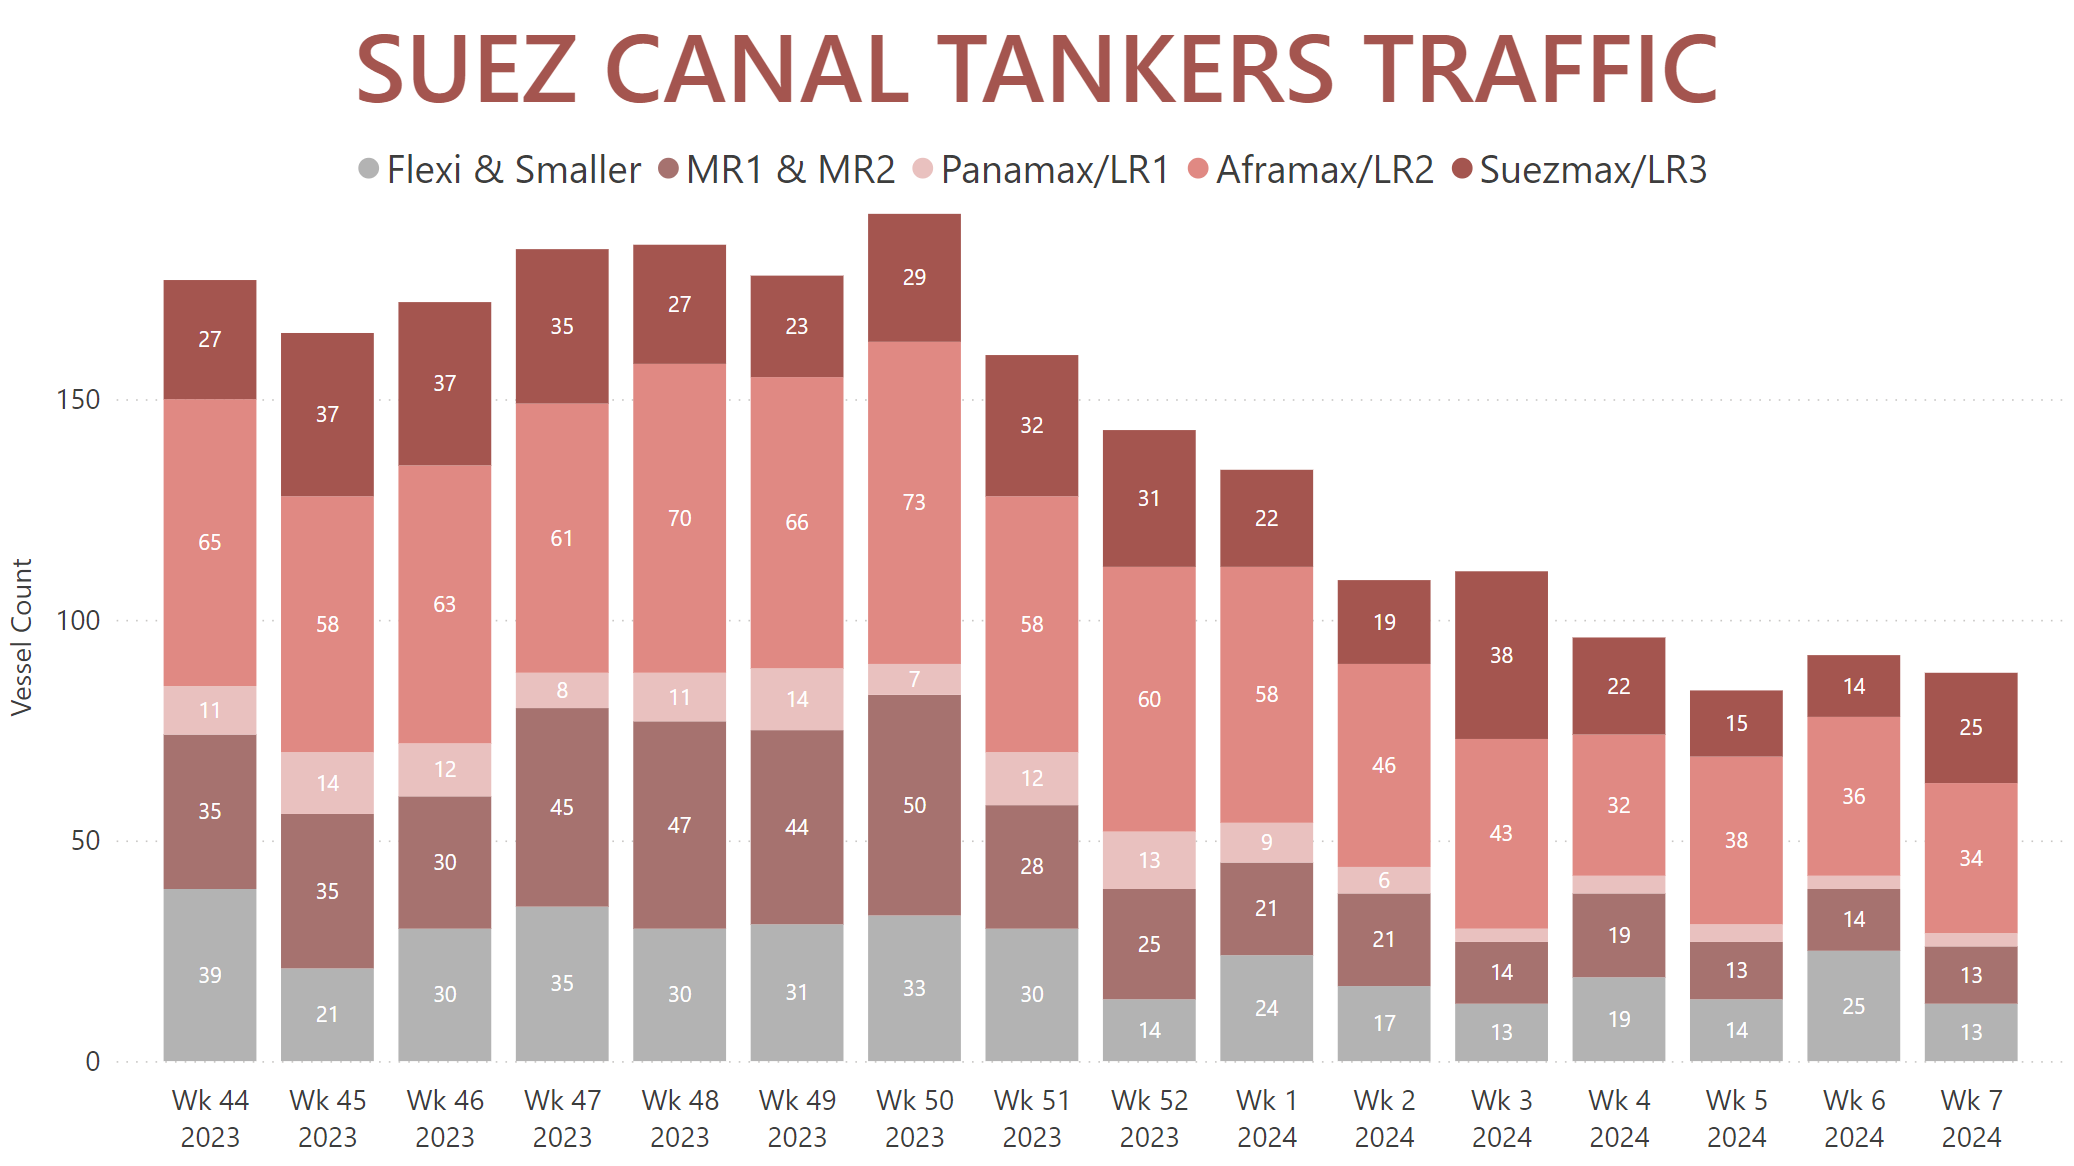
On to the Tanker market, Aframax/LR2 vessels between 85K and 120K MT of deadweight, along with their LPG and LNG equivalents traditionally make the most crossings of the Suez Canal. After mid-December 2023, their weekly counts dropped from the 60-70s range to less than 40 vessels per week since the end of January. Overall traffic through the Suez Canal of this vessel segment registered a 24% year-over-year decrease throughout the first month of 2024.
MR1 and MR2 Tankers between 34K and 60K MT of deadweight, having peaked at 50 vessels traversing the Suez per week by mid-December, have seen their crossings slip below 15 ships per week since the beginning of February. Traffic decrease for the mid-range segment throughout January was measured at 34.6% year-over-year.
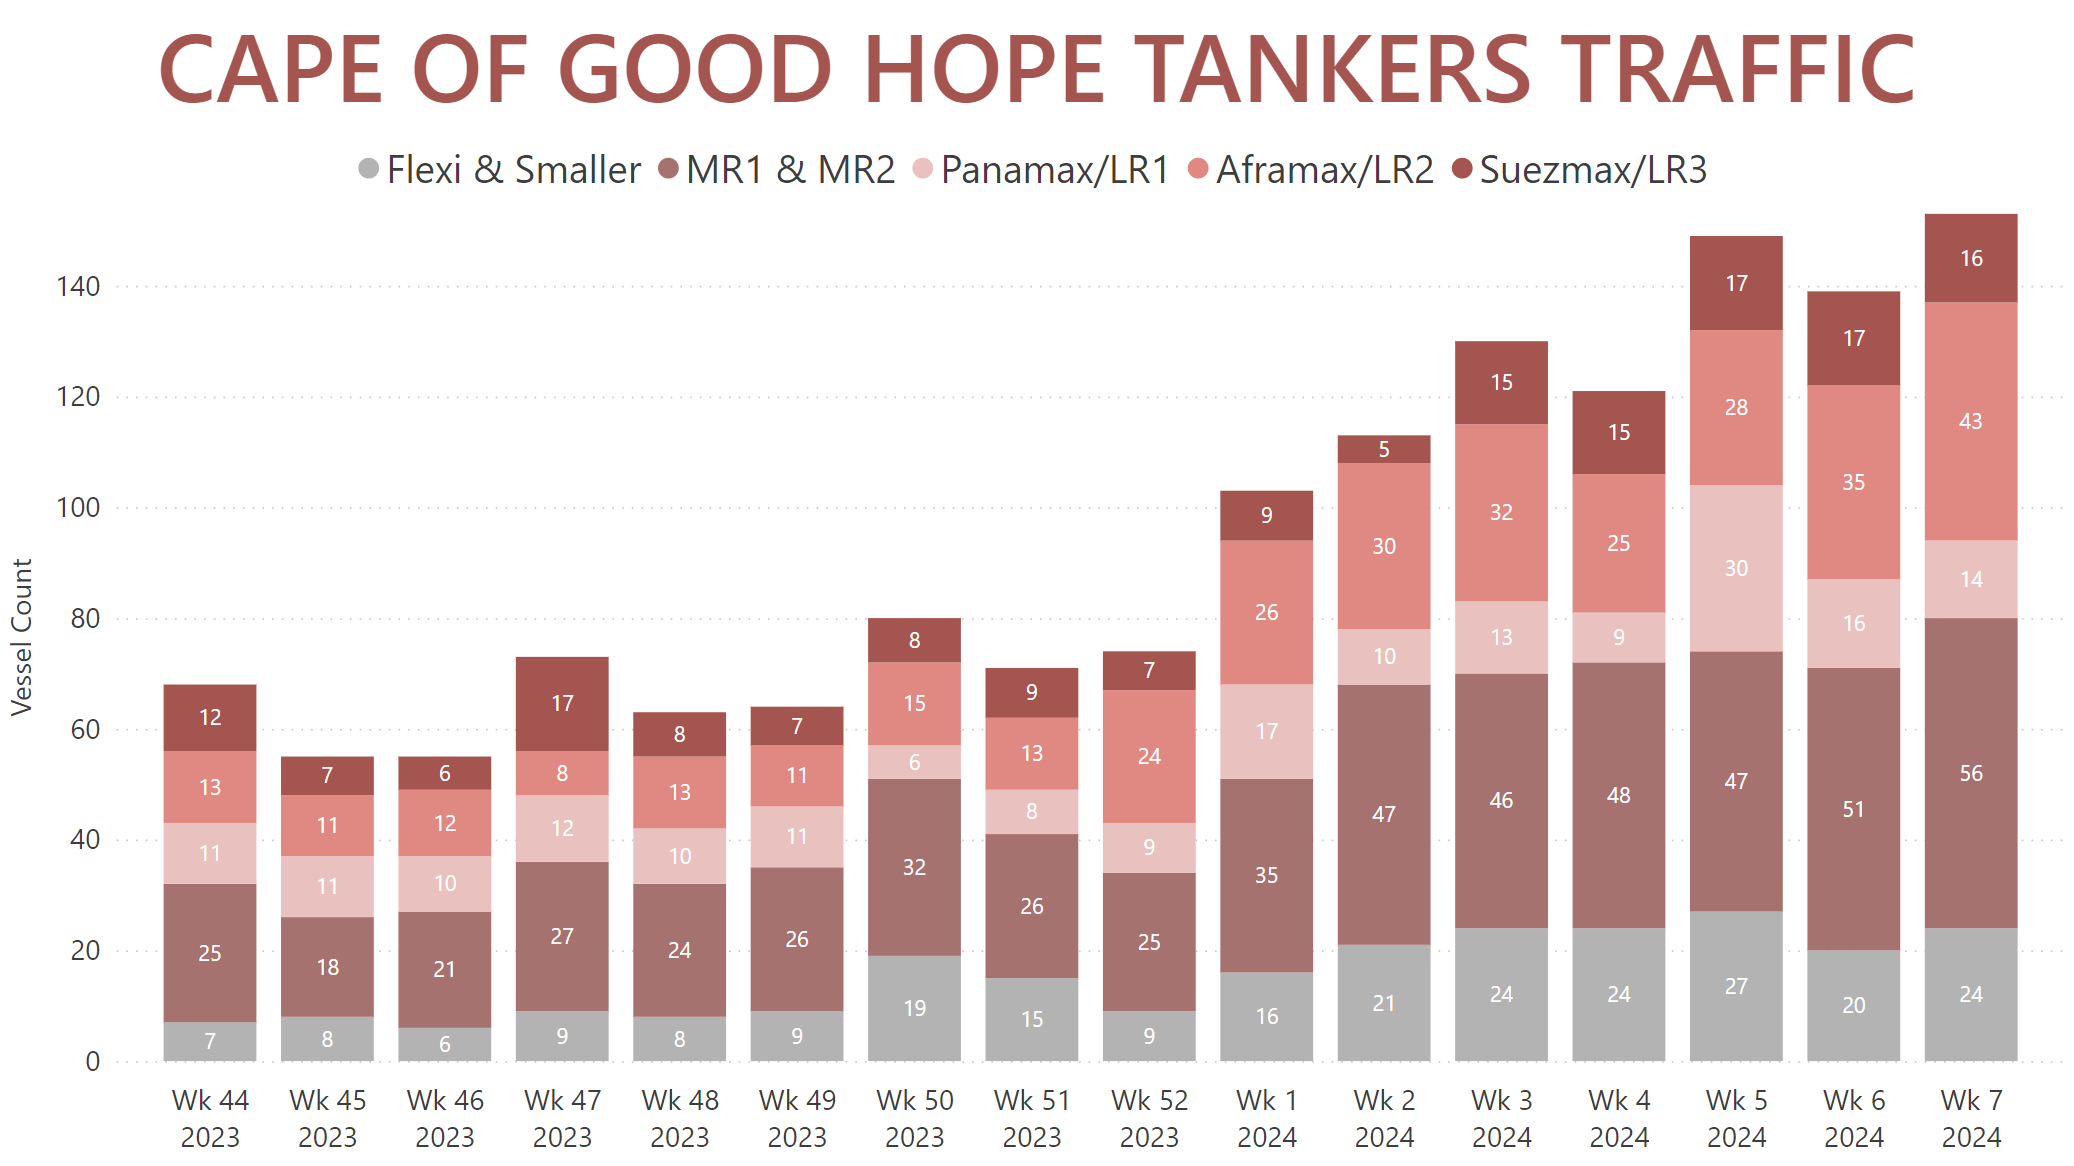
Increases in Tanker & Gas carrier reroutings were observed across all sizes. Suezmax/LR3 vessels between 120K and 200K MT of deadweight did not register a steady increase of their passages via the Cape of Good Hope until mid-January 2024. MR1 and MR2 traffic around the Cape has nearly doubled, while Aframax/LR2 vessels have nearly tripled in count compared to thirteen weeks ago.
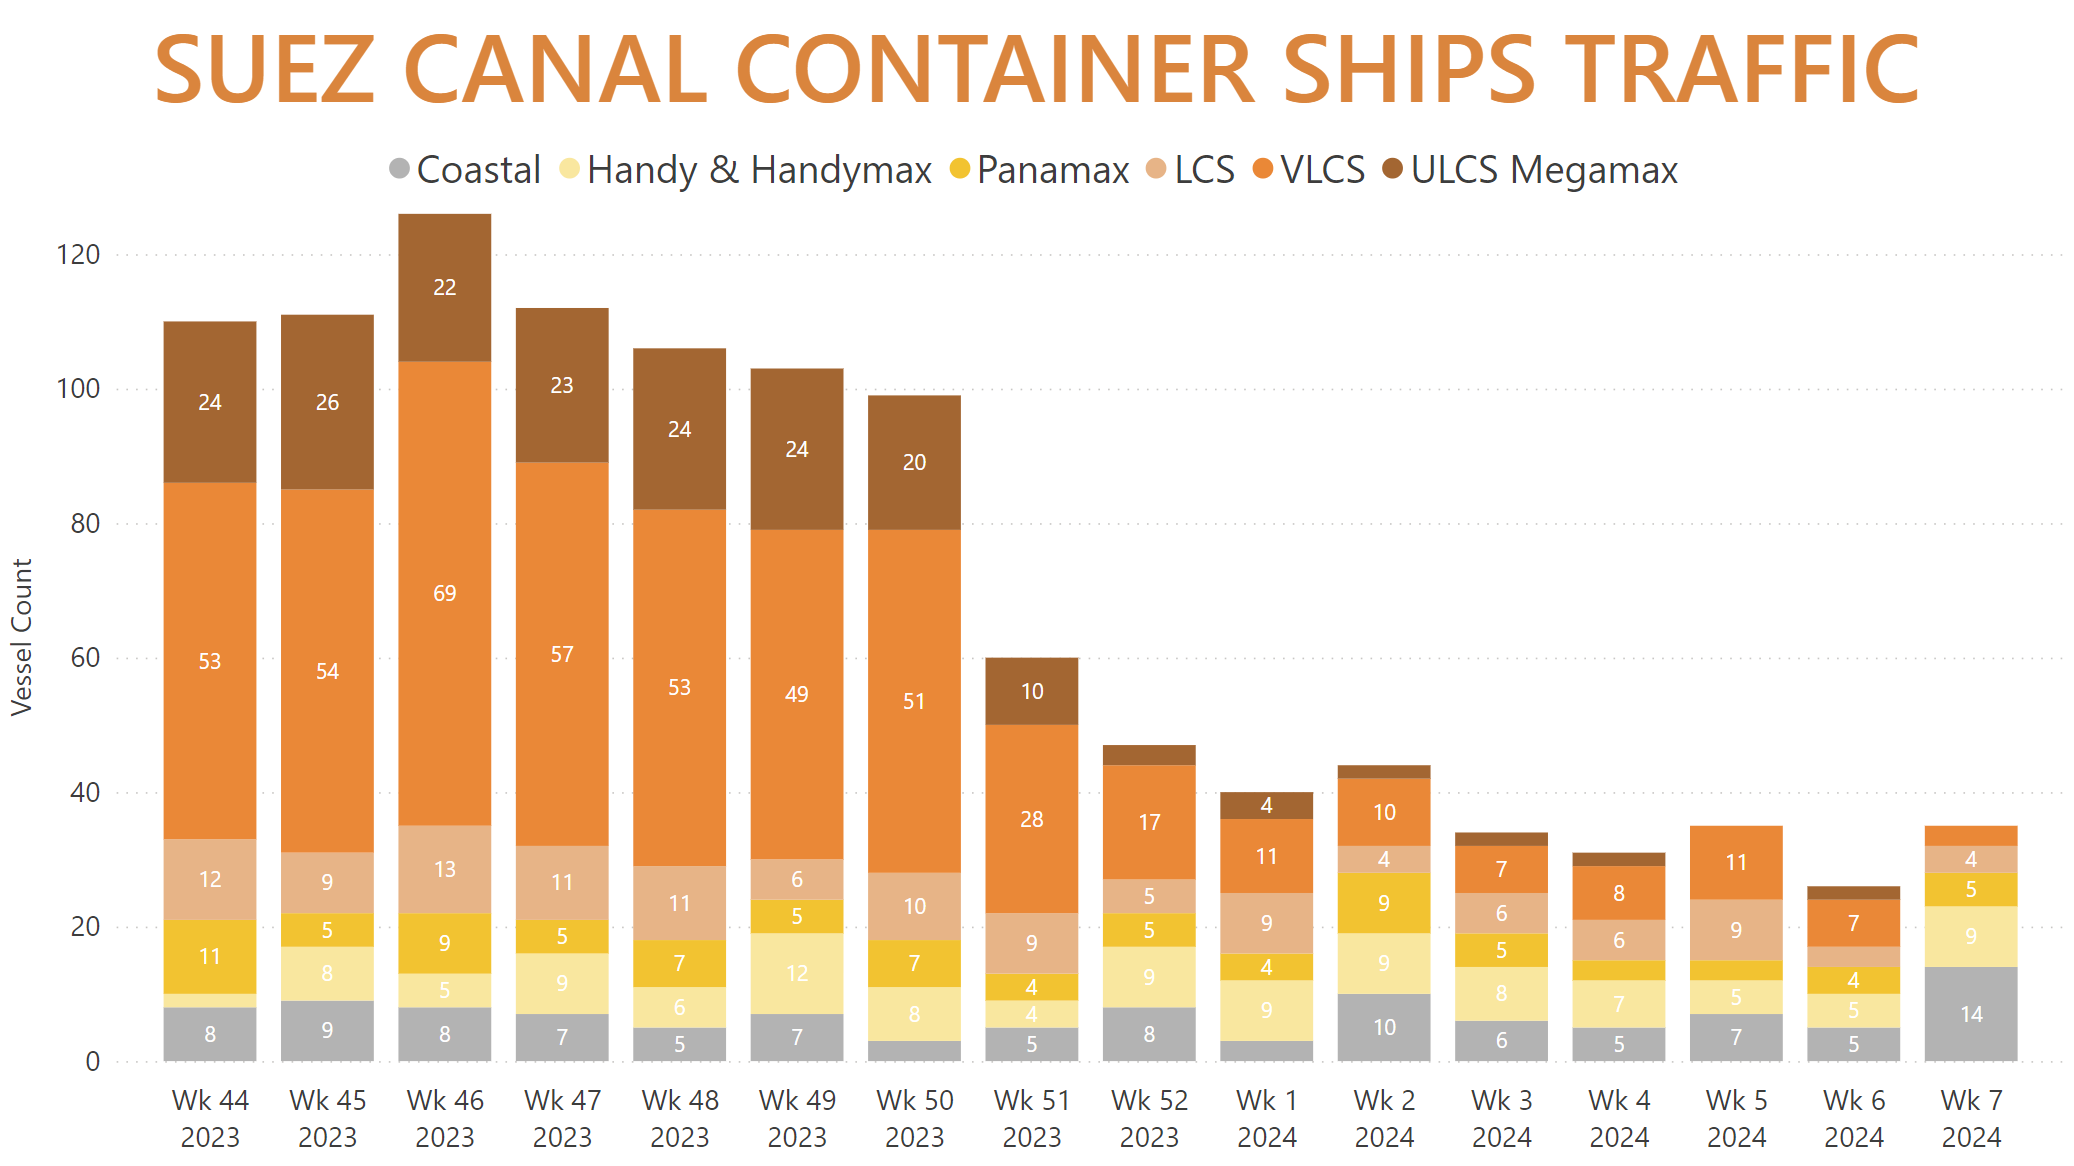
In the Container Ship market, the brunt of the Red Sea crisis was borne by VLCS- and ULCS Megamax-class carriers, exceeding 7,500 TEU capacity. The largest vessels in this market over 18,000 TEU capacity have virtually ceased their voyages, with only two Container Ships of this size crossing the Suez Canal since the start of February, while overall voyages through the Canal average out at less than 2 per week since the start of 2024. This represents a 93.9% reduction of traffic compared to the period immediately preceding the crisis.
While VLCS vessels between 7,500 and 18,000 TEU capacity do still make the occasional voyage through the Suez Canal, their weekly count has dwindled from a peak of 69 in the beginning of November to an average of 8 passages per week since the start of 2024.
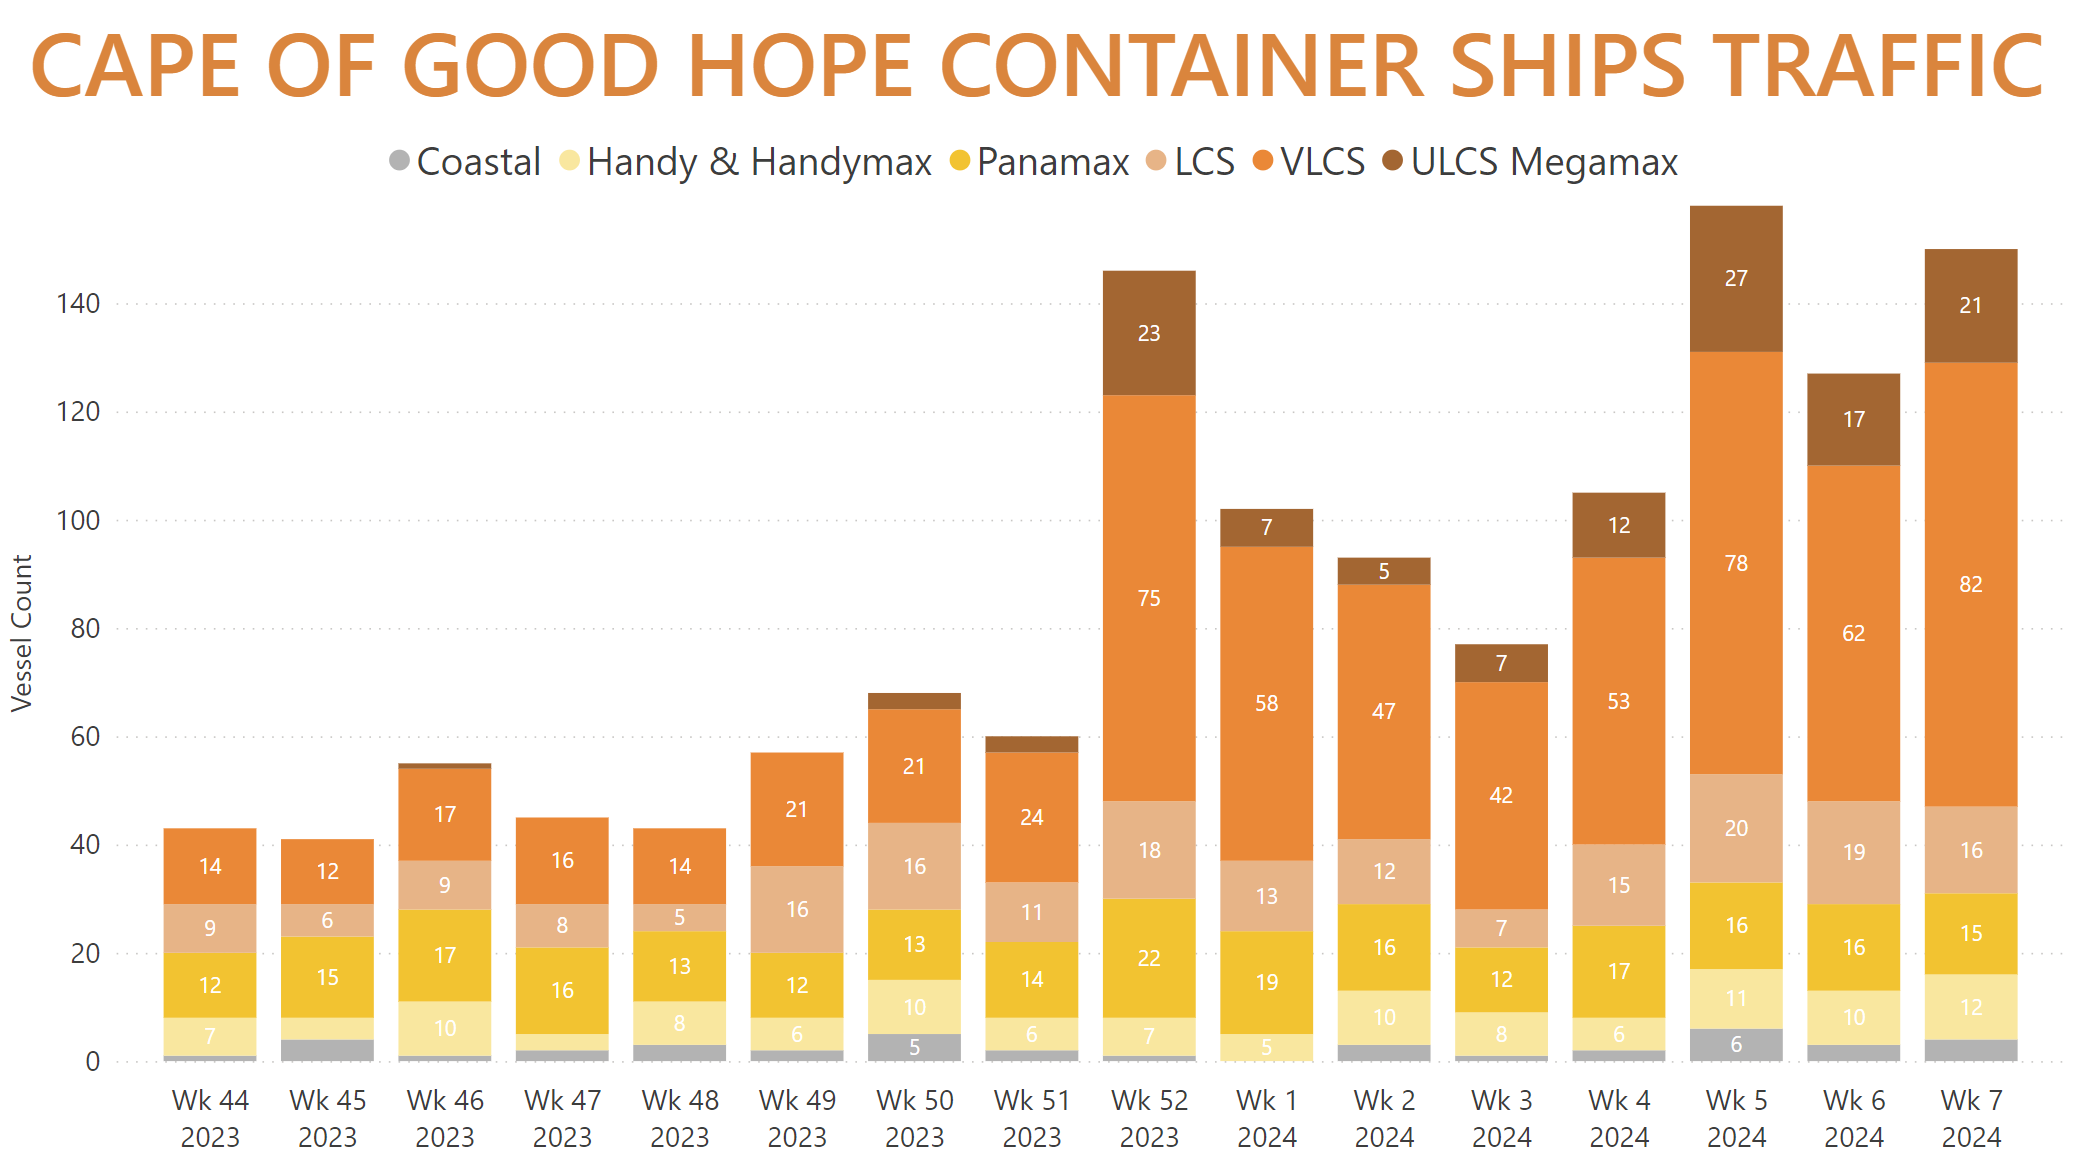
Consequently, ULCS Megamax carriers, which prior to the Red Sea crisis rarely ever passed the Cape of Good Hope, have done so at an average of 15 vessels per week since the end of December 2023. VLCS vessels rerouting via the Cape have increased in count four-to-five-fold over the past thirteen weeks.
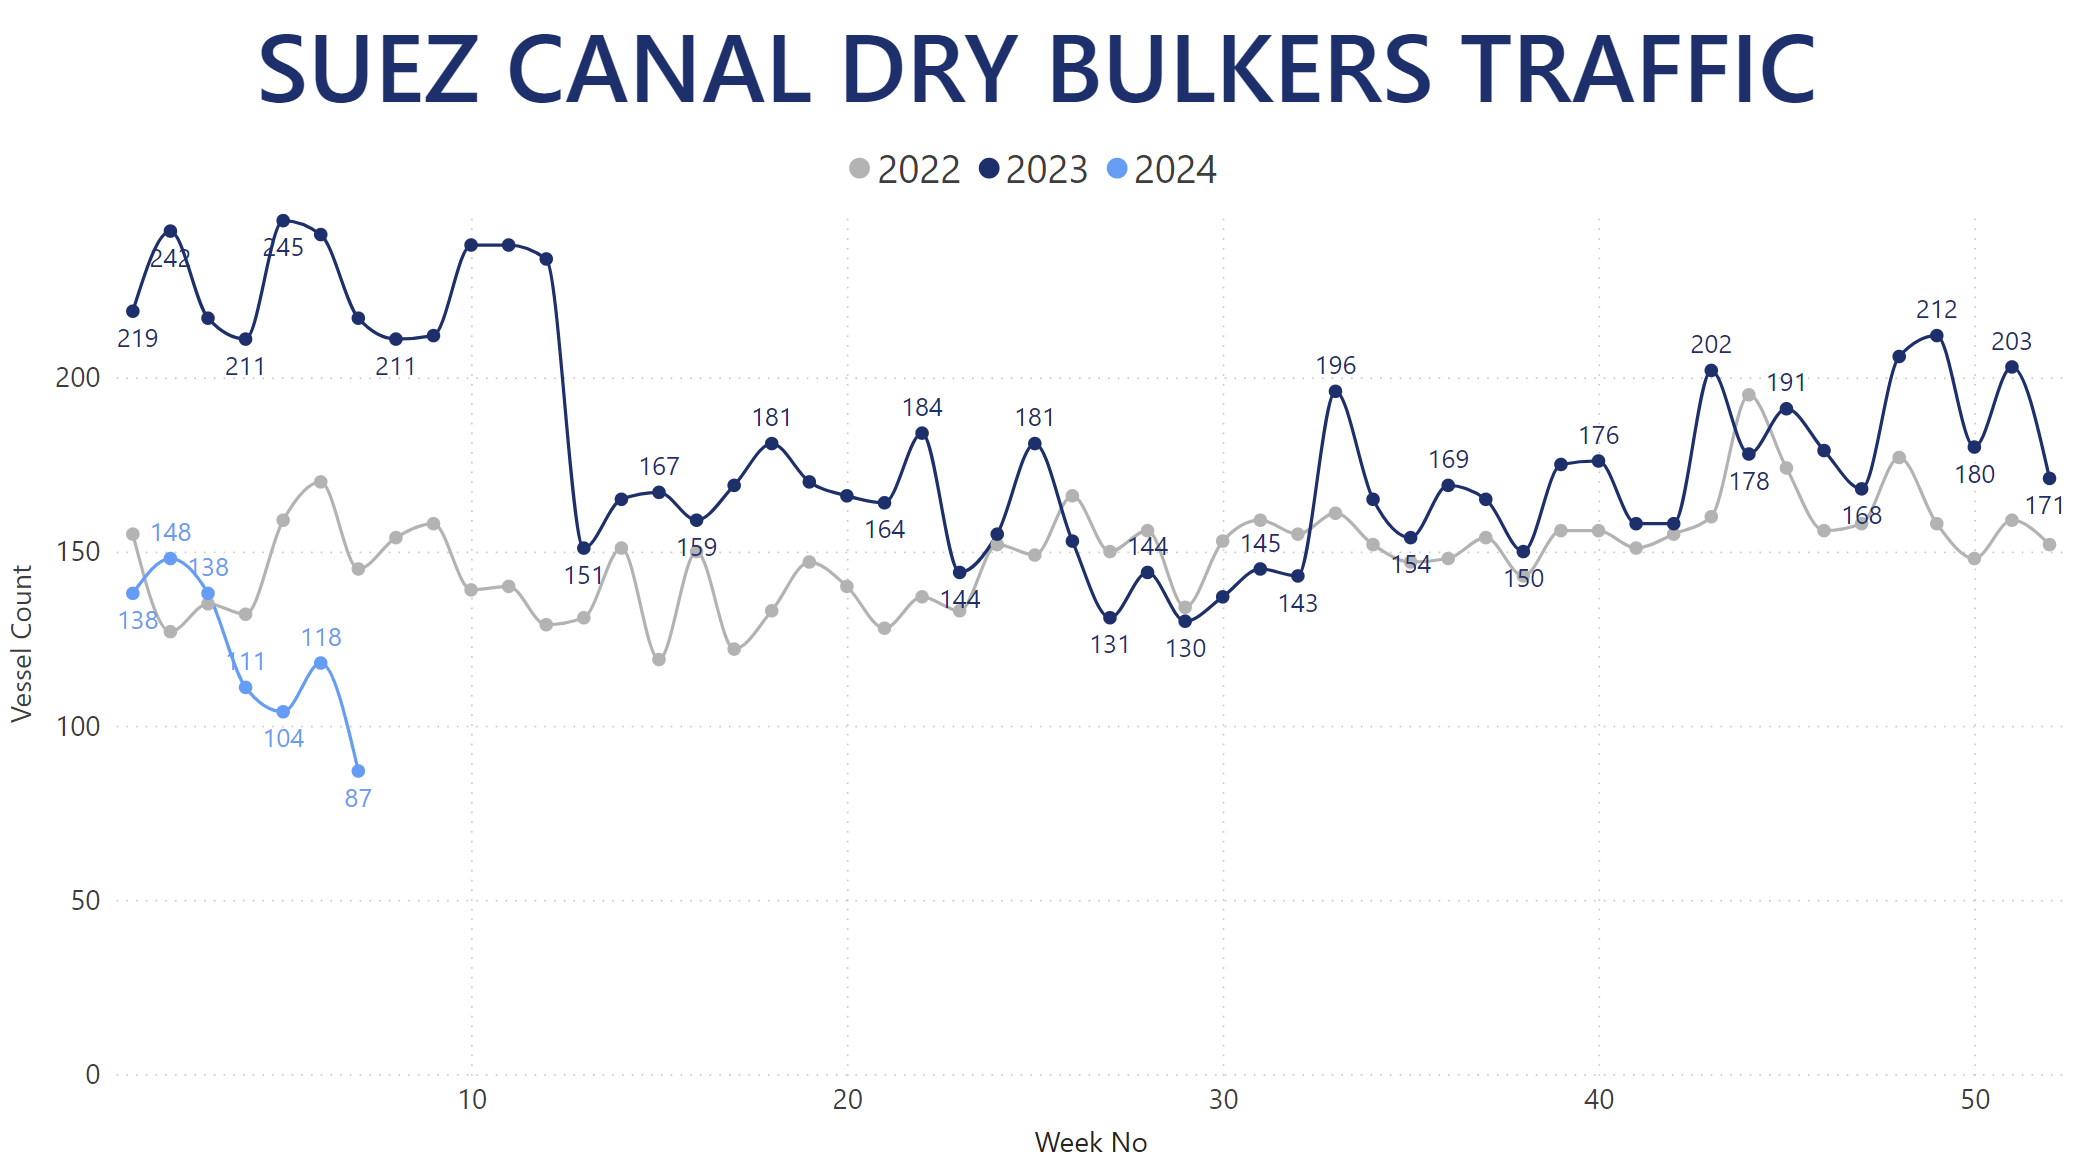
In a more historical context, the Red Sea crisis has not only decreased Dry Bulker traffic through the Suez Canal compared to 2023, which we previously covered in detail as a record breaker for Dry Bulk flows, but has also cut it down below 2022 levels, as well. Once again, this is the segment of the overall merchant fleet least affected by the crisis.
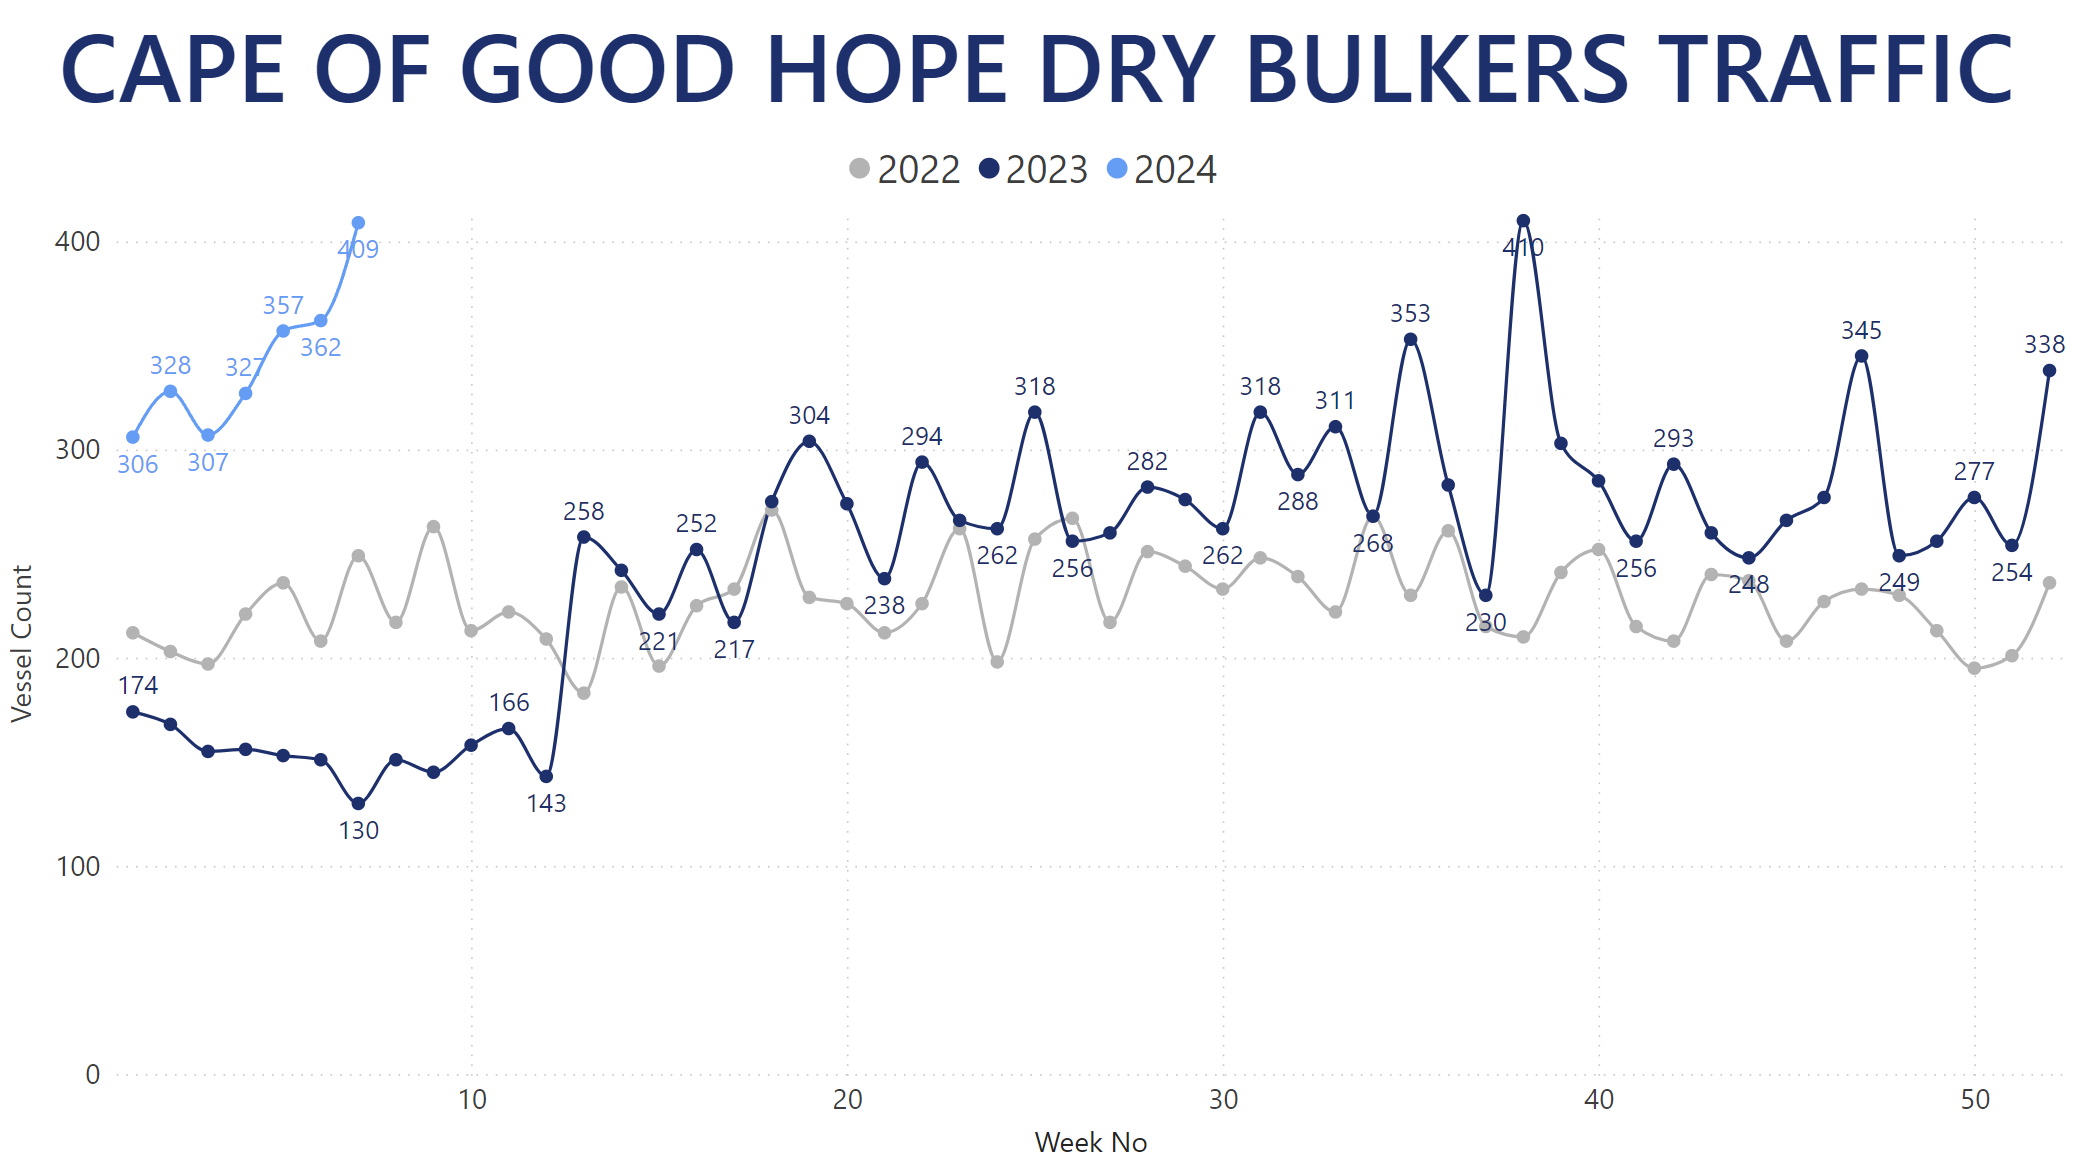
Compared to previous years, Dry Bulkers passing around the Cape of Good Hope have more than doubled year-over-year in recent weeks. Due to the traditionally high usage of this route, however, we're just shy of record-breaking territory. That being said, with no end in sight to the crisis, and last week nearly equalling the current highest weekly count, we might just get there in the upcoming months.
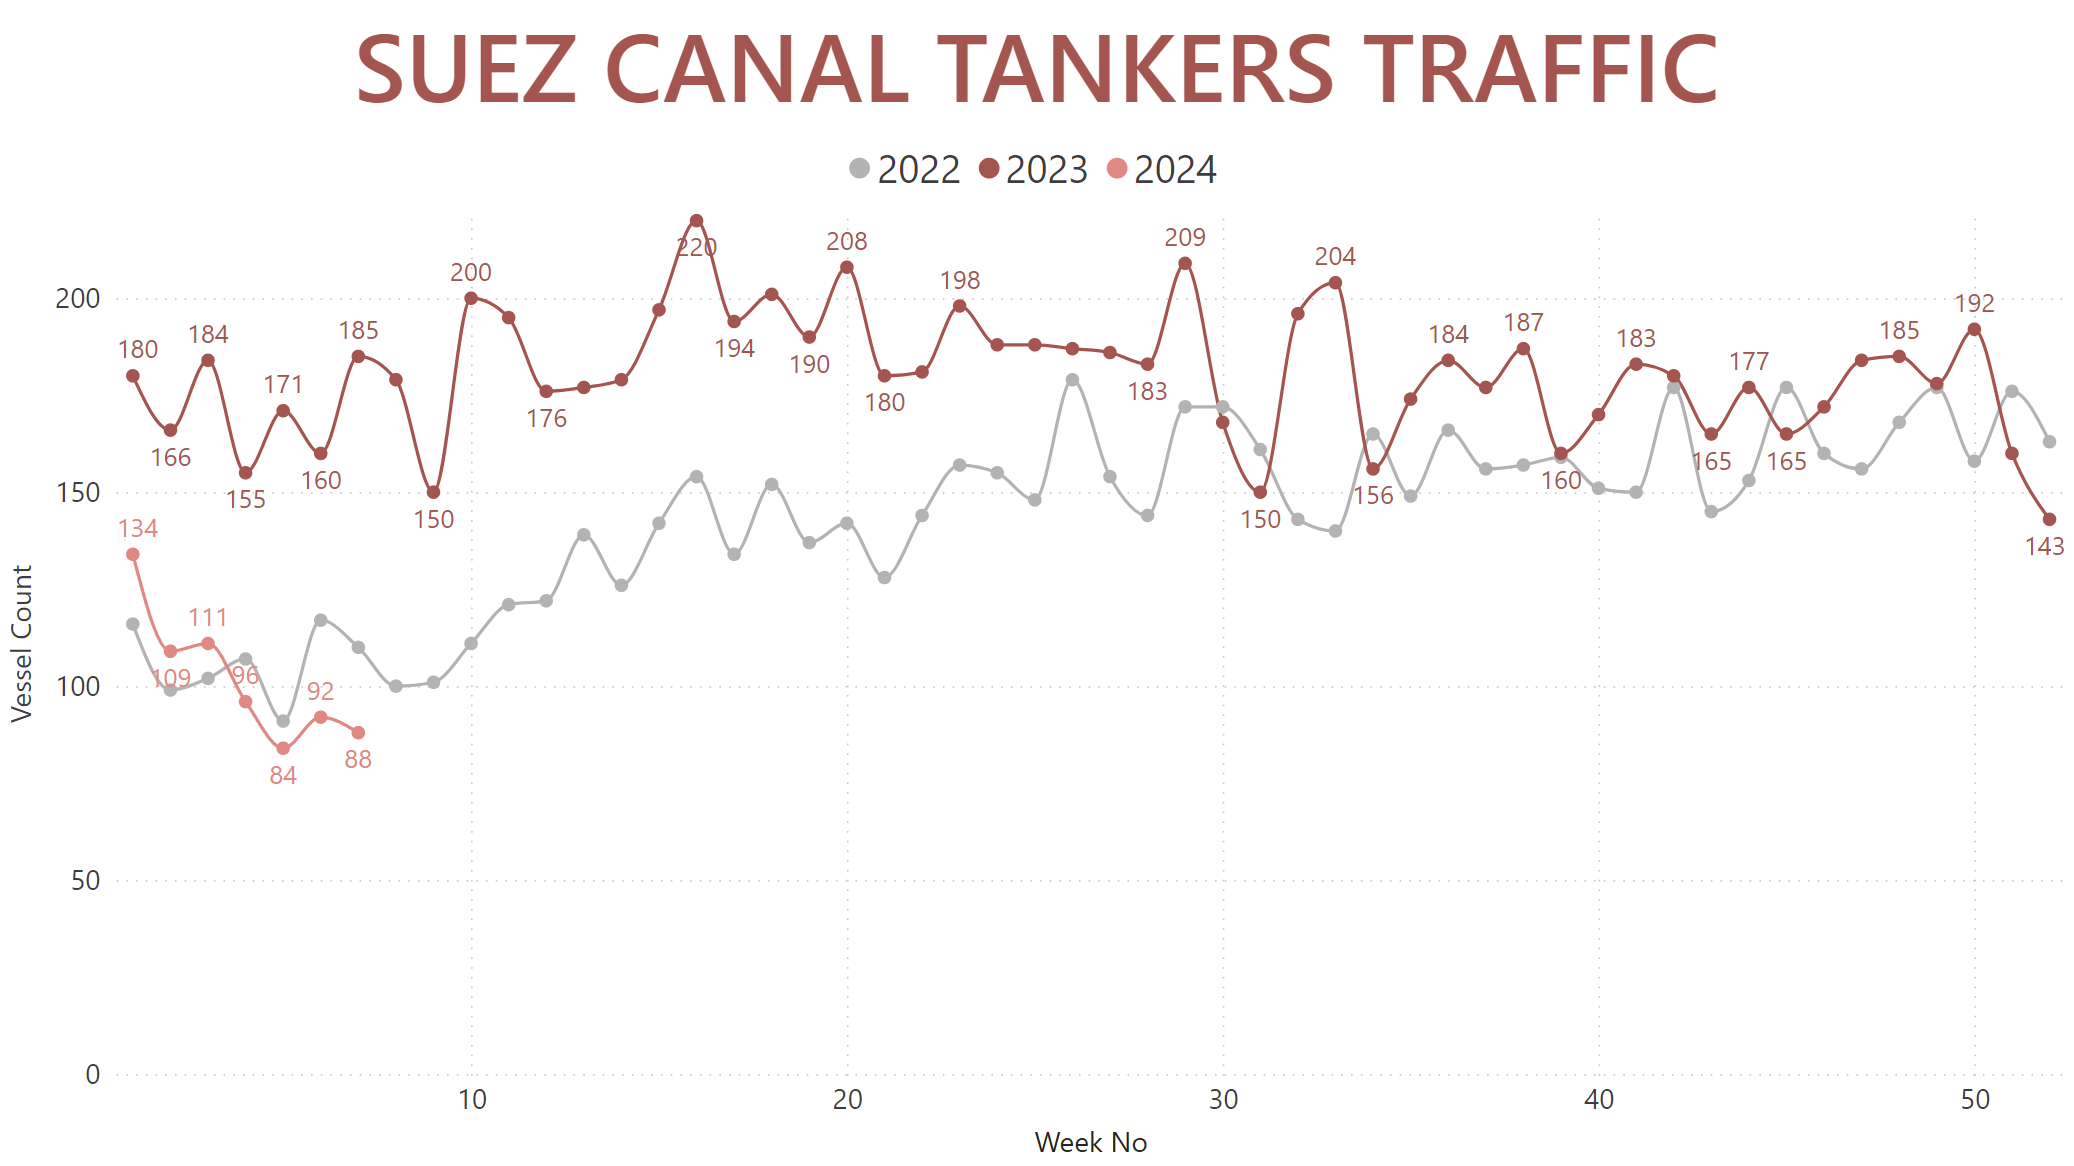
For Tankers and Gas carriers, the threat to the Bab al-Mandab Strait has also reduced Suez Canal traffic to below 2022 levels. This erased all the gradual boost of Tankers passing through the Canal, which had previously materialized in the wake of Russia's invasion of Ukraine and the resulting increased Tanker traffic from Russia to India and the Far East. Average drop of weekly vessel passages through the Suez Canal since the start of 2024 currently stands at 40.5% year-over-year.
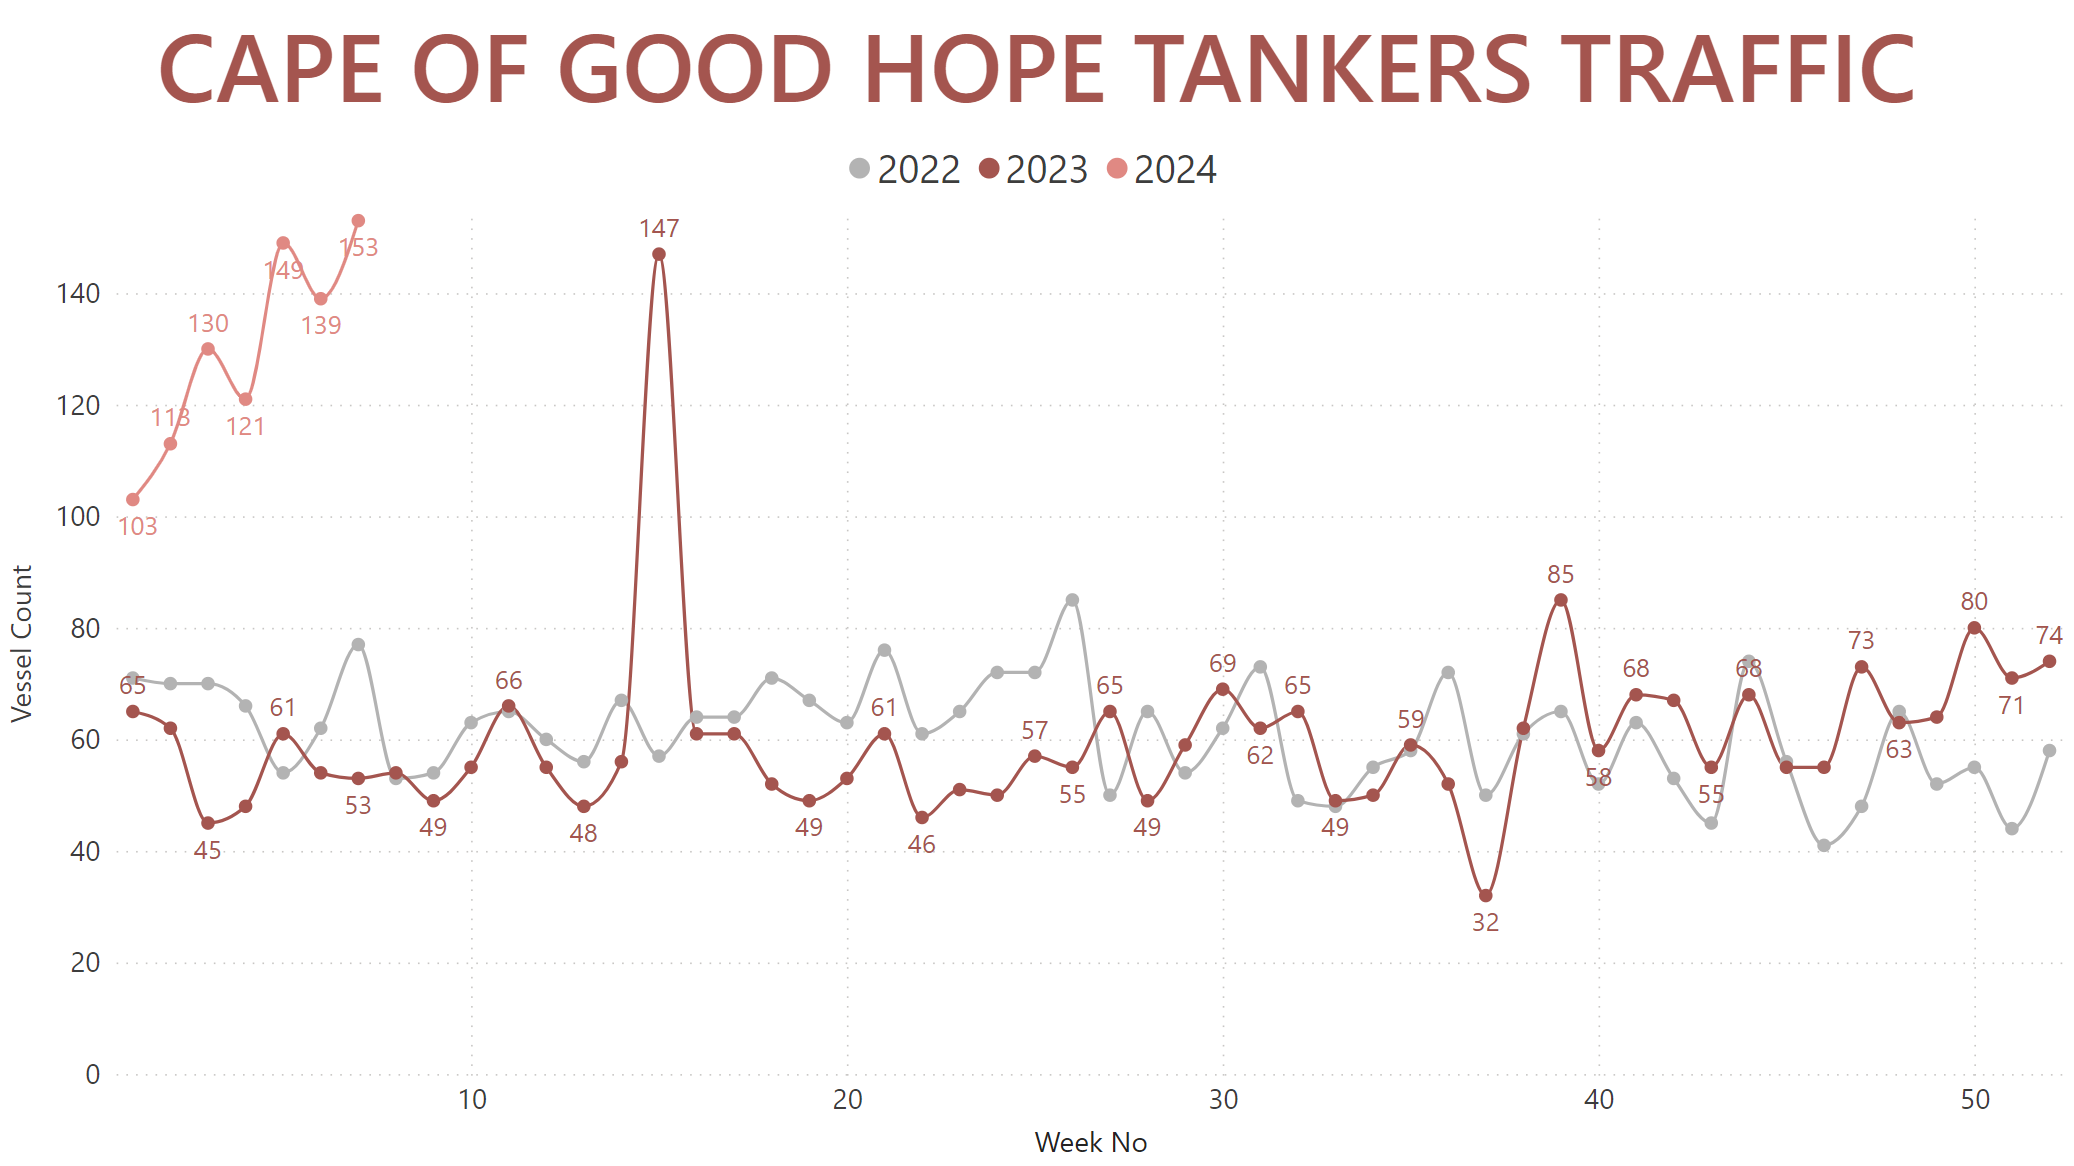
Unlike Dry Bulkers, Tankers and LPG/LNG carriers below 200K MT of deadweight routed via the Cape of Good Hope at an average rate of less than 70 vessels per week before the Red Sea crisis began. In its direct aftermath and especially since the start of January, over 100 vessels (excluding VLCCs from this count as they cannot traverse the Suez Canal fully laden) have consistently passed via the Cape. Over the past five weeks in particular, this translates into a 165% year-over-year increase of the number of Tankers routing via the southernmost point of Africa.
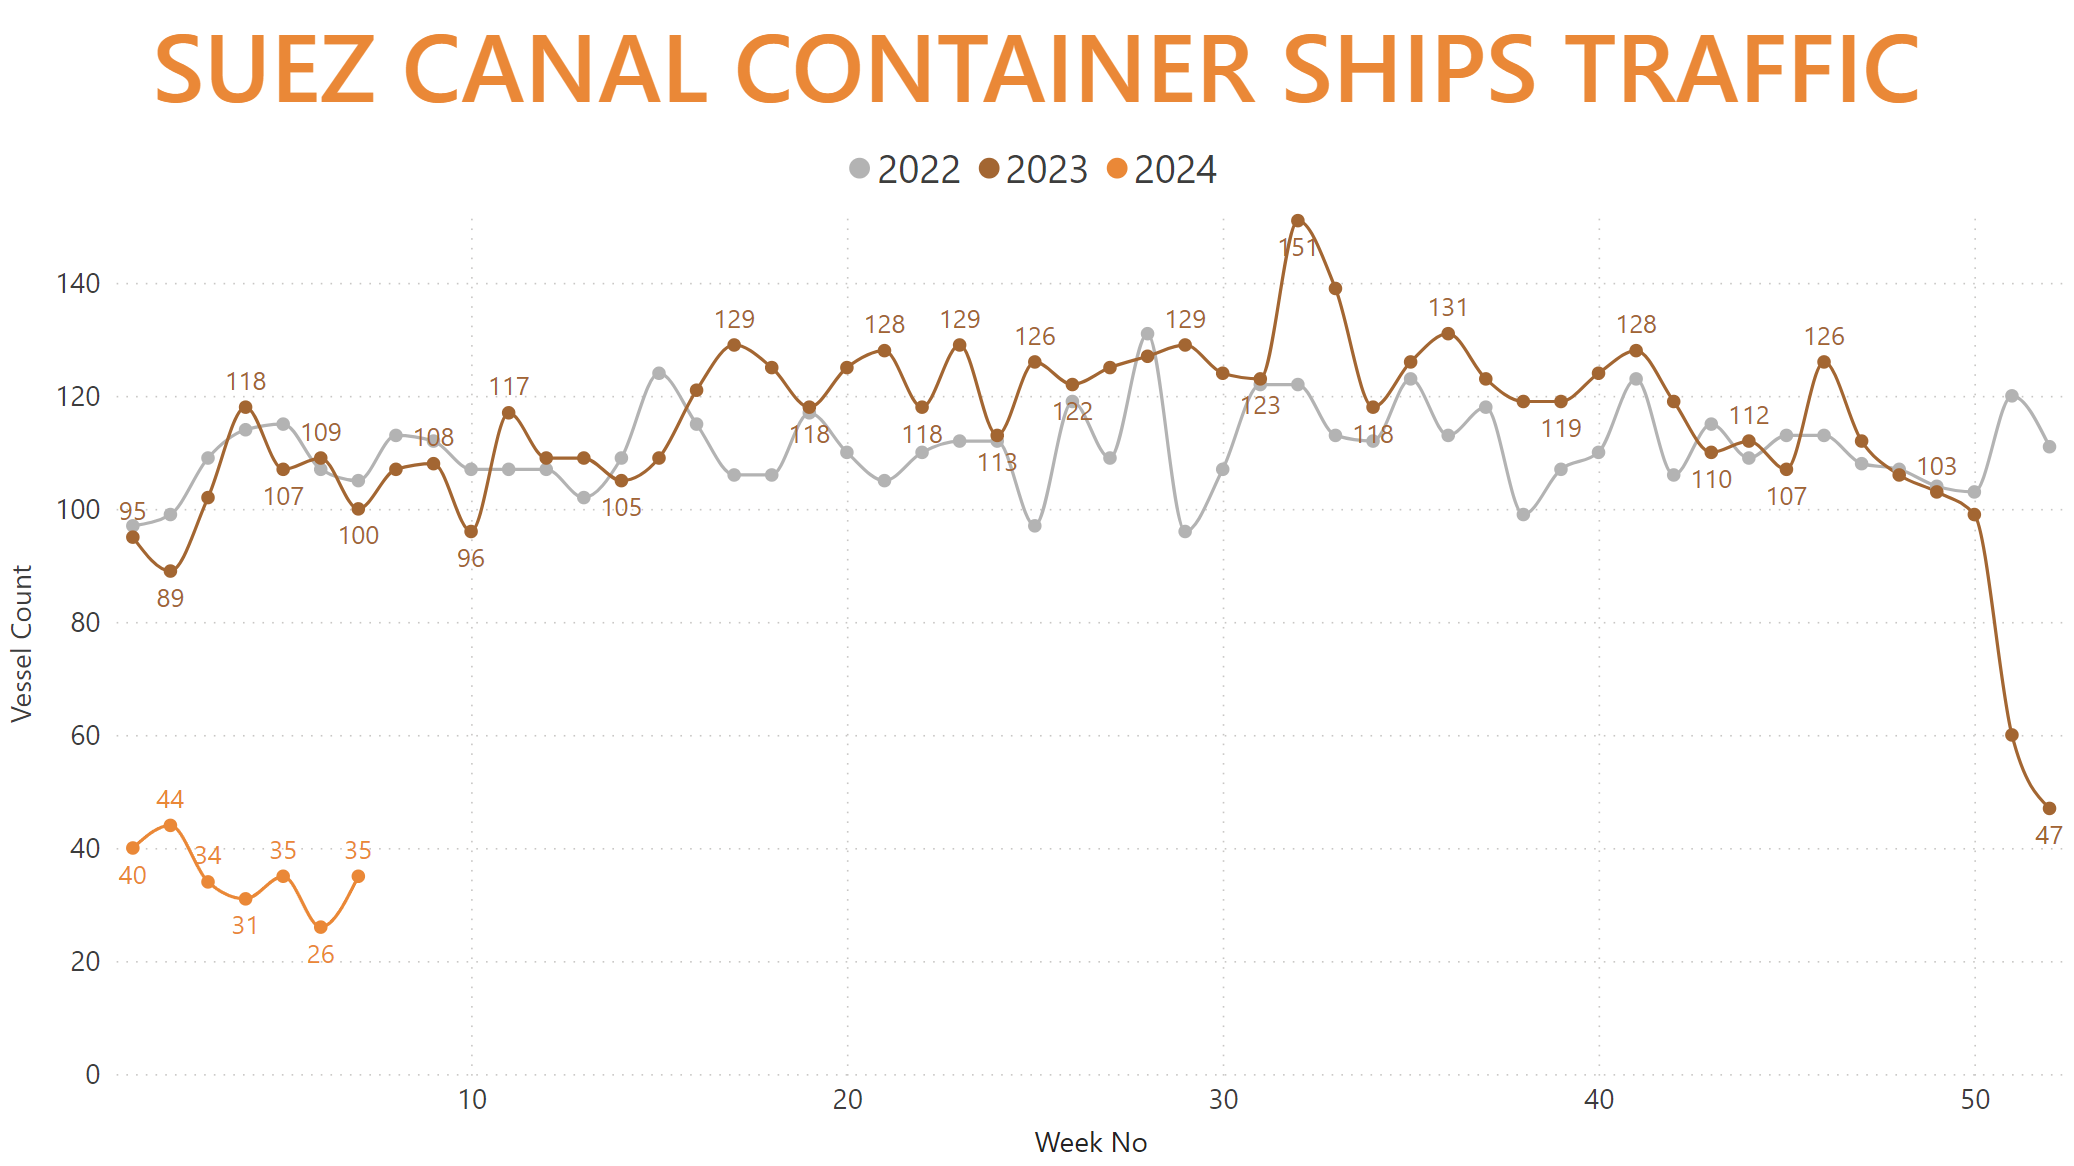
The drop of Container Ships weekly traffic through the Suez Canal as a result of the Red Sea crisis began the earliest, compared to Dry Bulkers and Tankers, and had the most sudden drop from mid-December 2023 onwards. As we're now in the region of historic low counts, the second week of February registered a 76.2% year-over-year decrease in the number of Container Ships traversing the Suez Canal, with the average weekly decrease since the start of 2024 currently standing at 65.3%.
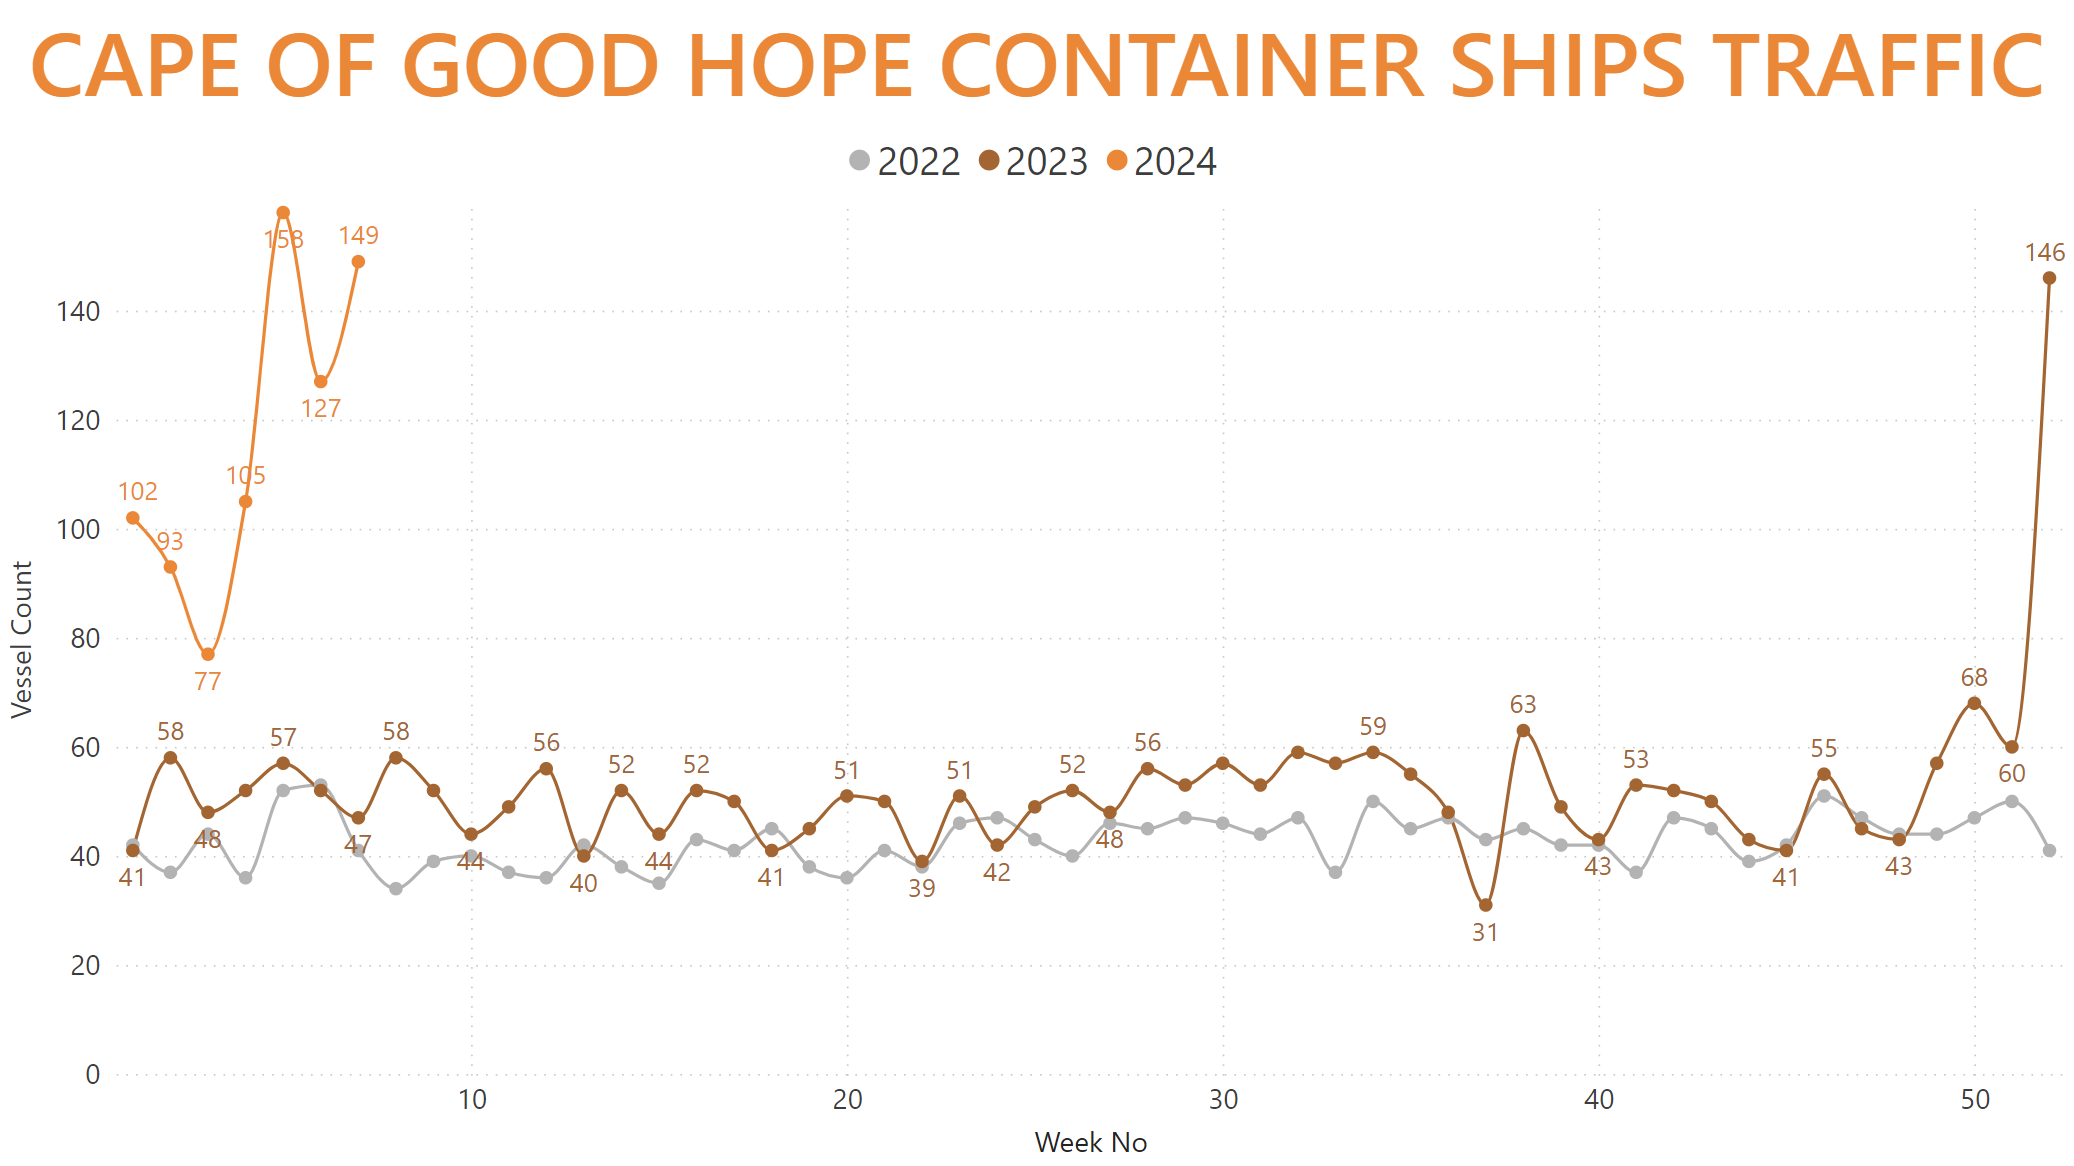
Container Ships passing via the Cape of Good Hope have more than tripled in count over the recent weeks, registering an average year-over-year increase of about 130% since the start of the year. As a reminder, for a voyage from Singapore to Rotterdam rerouting via the Cape of Good Hope adds over 3400 nautical miles, or about 10 days at 15 knots of speed, to the journey.
As the recent Houthi attack on the MV STAR IRIS, carrying corn from Brazil to Iran, shows the indiscriminate nature to the risk imposed on the Red Sea vessel traffic, experts uniformly do not expect a recent resolution to the crisis. As such, we expect to see the current Suez Canal and Cape of Good Hope traffic trends continuing in the immediate future.
AXSInsights is an interactive solution that allows you to segment and interact with various Big Data parameters. It can be tailored around individual specific business needs. If you have to follow a niche commodity, fleet, or region of the world, a bespoke report to meet your exact requirements can be tailored around your needs. Book a demo below to see everything AXSInsights can do for you.