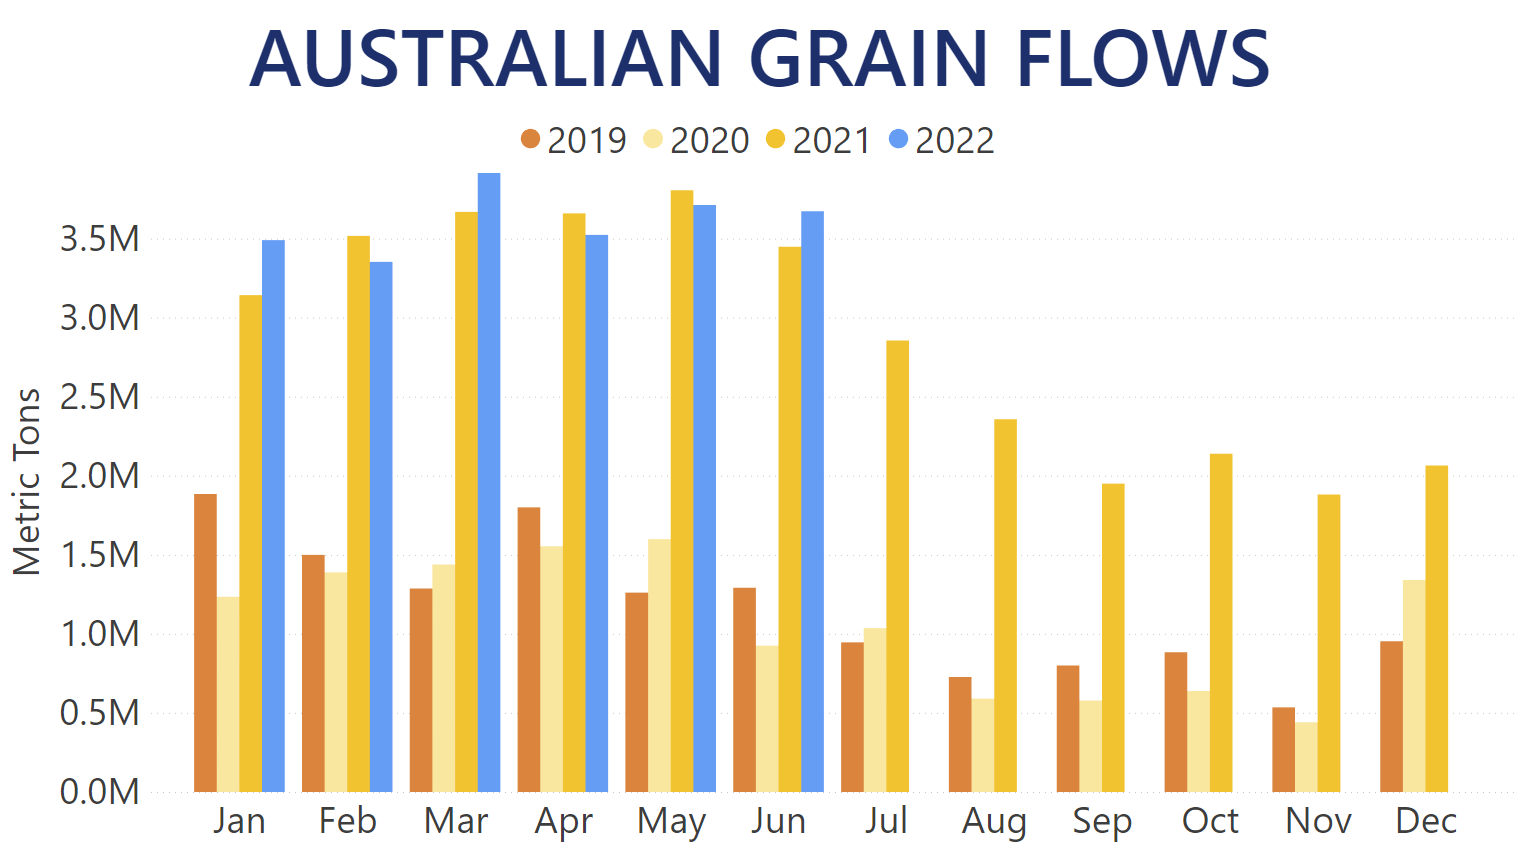
Australian Grain flows throughout H1 2022 managed to surpass quantities shipped during the so-far record 2021 levels. Our Trade Flows data suggests during the first six months of this year, over 21.6m MT of Australian Grains were discharged worldwide, representing a 2% year-over-year increase. The year started off fairly strong, with January shipments registering an 11.1% year-over-year improvement. In March alone, a new record was set for most Australian Grains discharged in a single month. At over 3.9m MT it was a 6.7% year-over-year boost and an increase over the previous record set in May 2021 by 2.8%. In June, just under 3.7m MT of cargo was unloaded across the globe for a 6.5% year-over-year gain. Meanwhile, current discharge levels in July indicate a 54.8% increase over quantities shipped during the same period of last year.
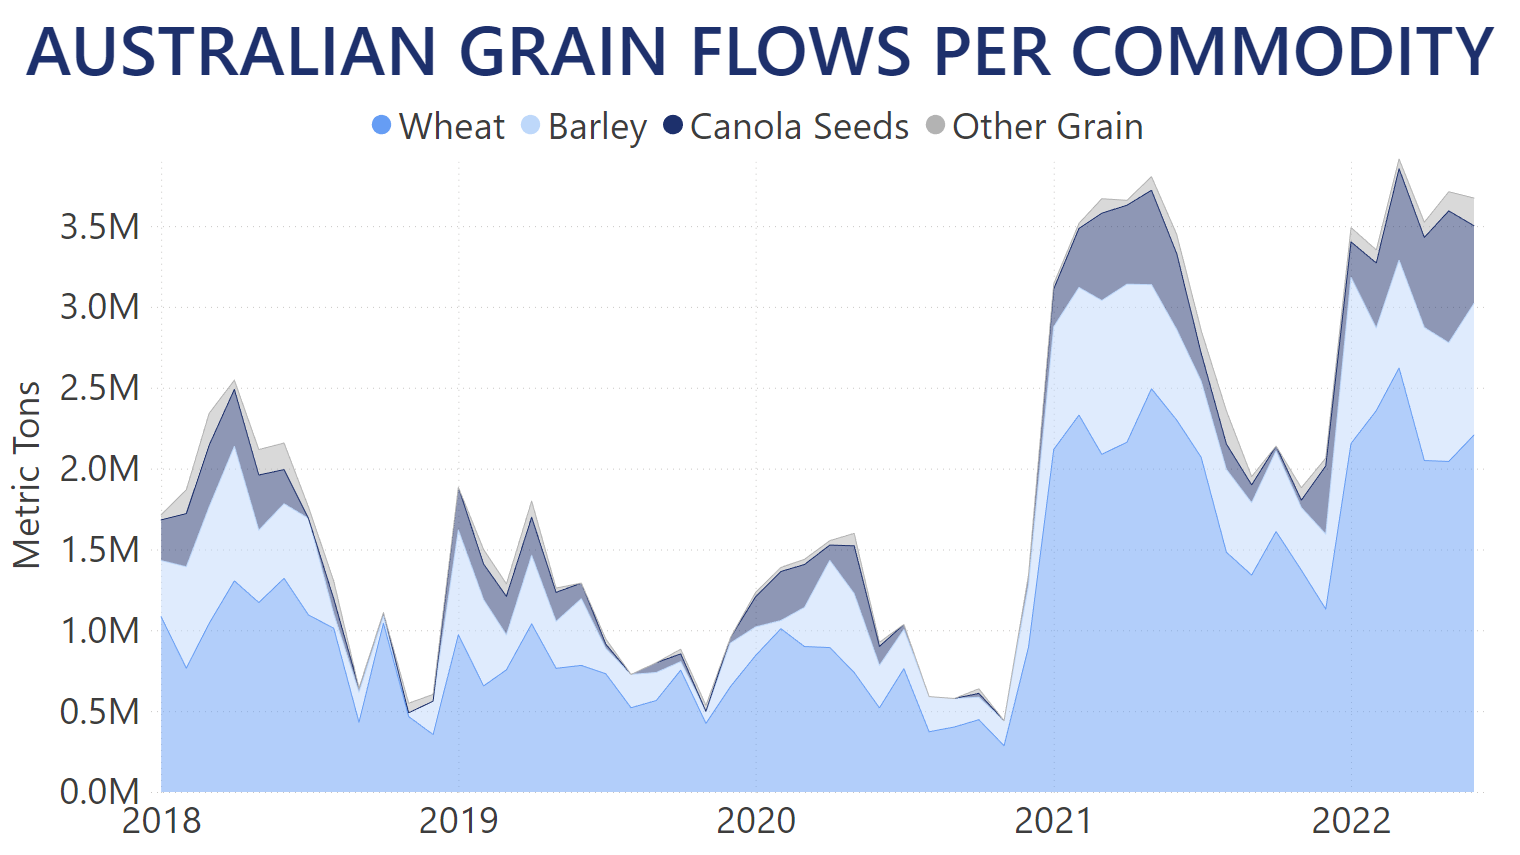
Wheat remains the most commonly exported Grain type, composing over 60% of all Australian Grain shipments throughout H1 of 2022. Nevertheless, at 13.4m MT between January and June, global discharges of Australian Wheat registered a marginal decrease of 0.4% year-over-year. The overall weaker performance was salvaged by the record month of March, when over 2.6m MT of Wheat were unloaded globally, representing a 25.6% year-over-year boost in that month alone. Barley, which is the second-most exported Grain type out of Australia, also registered lower quantities transported in H1, compared to its 2021 performance. At less than 4.6m MT of cargo carried by vessel between January and June, it was translated into a 2.3% year-over-year decrease. At just over 3m MT, Canola Seeds shipments increased by 13.4% throughout H1 compared to 2021 levels. In May alone, over 800,000 MT were discharged worldwide, setting their own record and surpassing Barley during that month. Overall, Canola Seeds represented just over 14% of all Australian Grain voyages in H1, compared to a 12.6% market share during the same period last year. Meanwhile, Lupins, Sorghum, and other less commonly exported Grain types combined were boosted by 58.9% year-over-year.
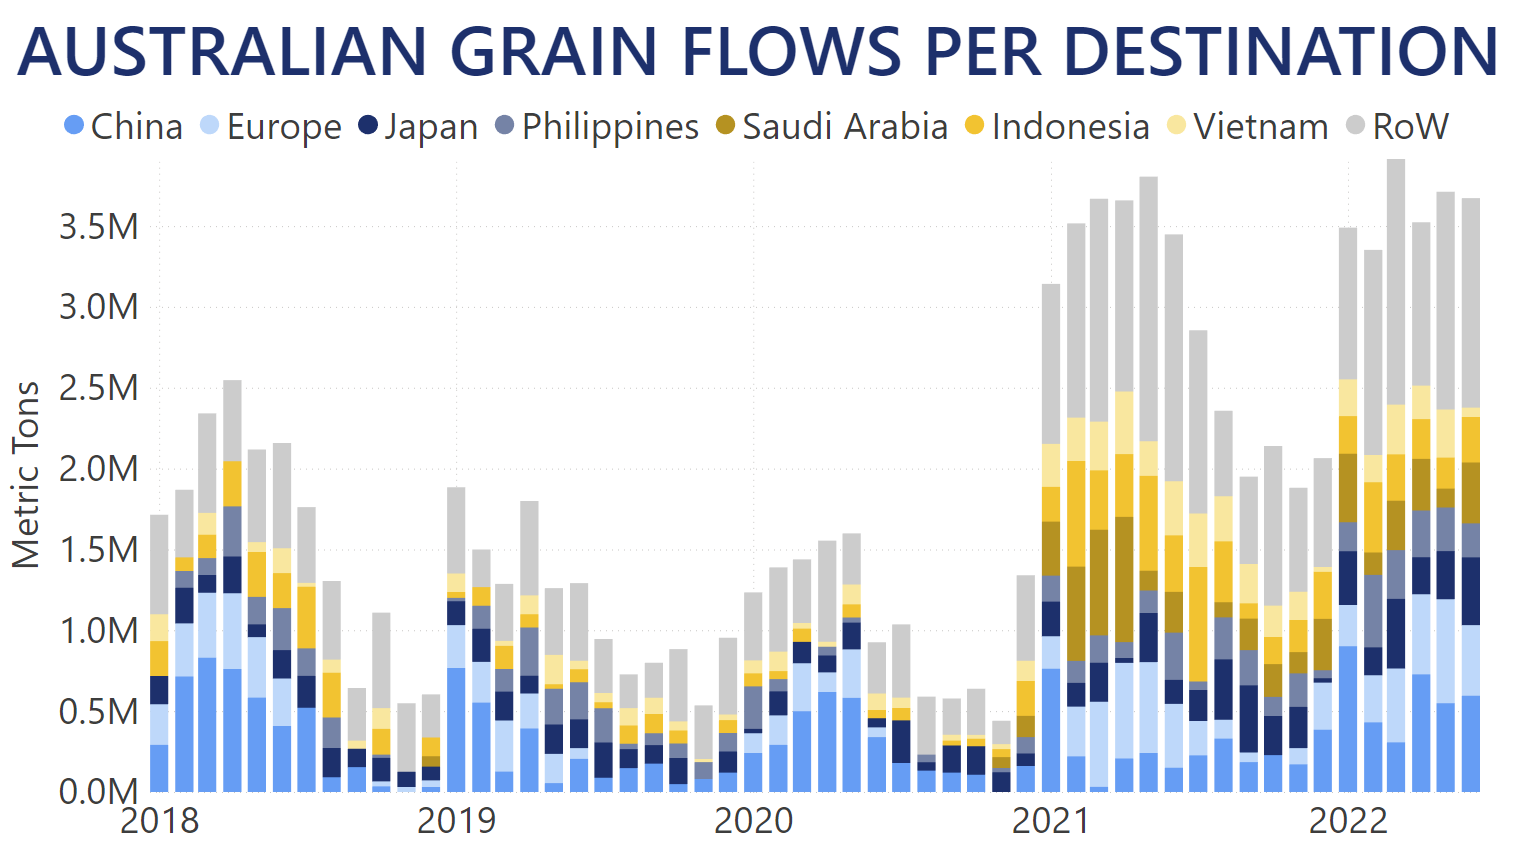
China was the largest single importer of Australian Grains during the first six months of 2022. Over 3.5m MT of cargo was discharged at Chinese ports, representing a 117.6% year-over-year increase, and giving the largest importer of Australian Grains a 16.2% market share. That being said, the triple-digit improvement was largely owed to the historically low levels of Chinese imports in 2021. For comparison, quantities discharged in H1 2022 are 2.2% lower than the same period of 2018. The second-largest market for Australian Grains were the EU-27+ community. Overall quantities shipped to Europe between January and June were on par with last year's levels at just under 2.6m MT total for a market share of 11.9%. Nevertheless, the last two months registered 14.6% and 10.7% year-over-year increases in Australian Grains unloaded at European ports, with quantities discharged in May alone temporarily setting Europe as the largest importer in the market. Japan and the Philippines boosted shipments of Australian Grains at their ports by 73.3% and 70.6% year-over-year, respectively. Meanwhile, throughout H1, last year's most prolific importers Saudi Arabia and Indonesia decreased cargo discharges by 38.2% and 34.7% compared to 2021 levels.
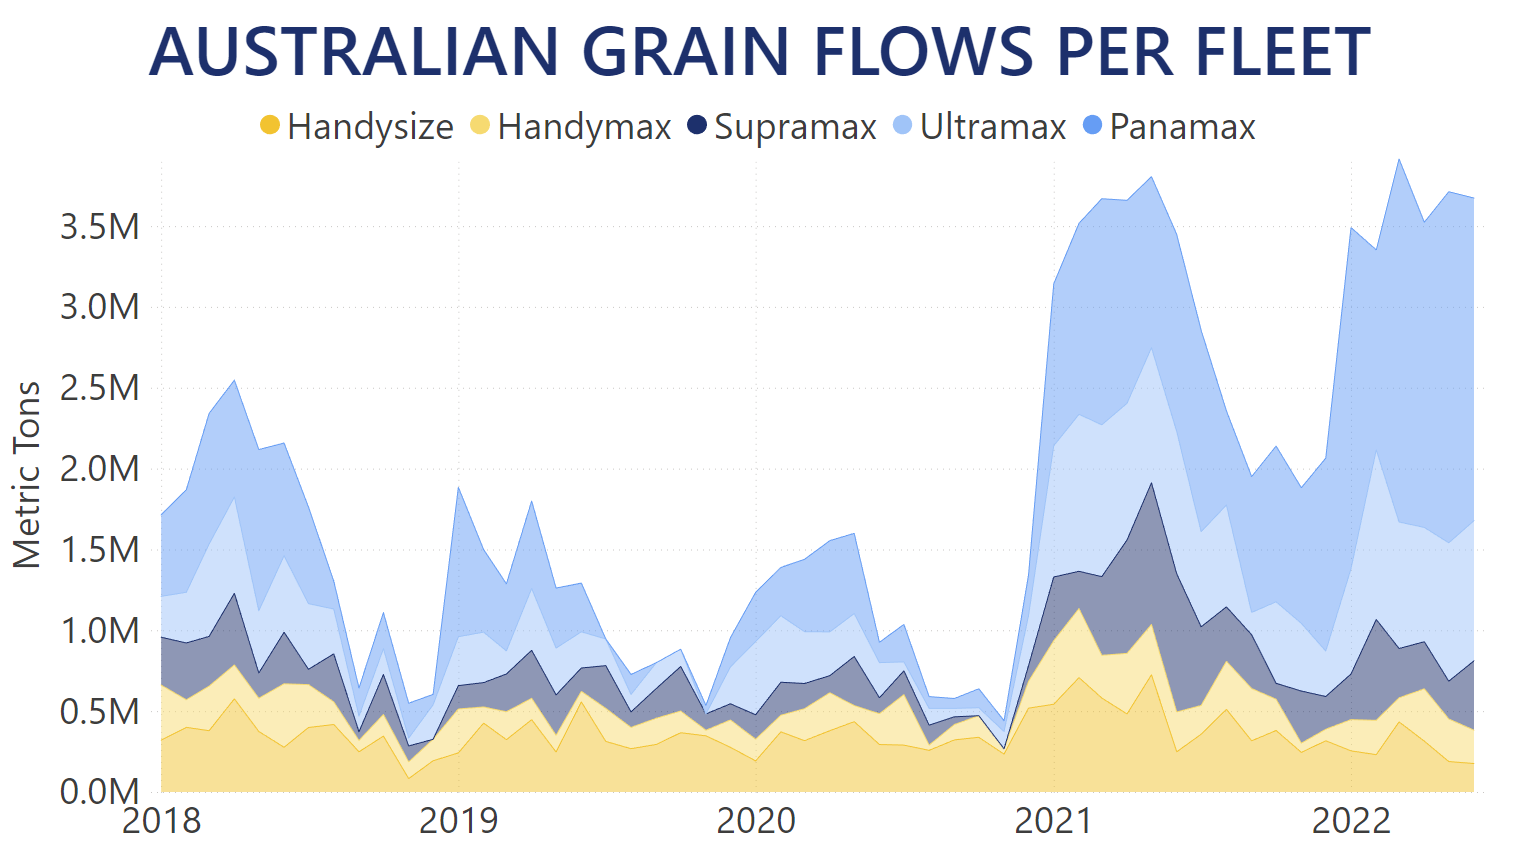
While Panamax vessels had the largest share of any fleet segment carrying Australian Grains last year, during H1 of 2022 their utilization was boosted even further. With over 11.6m MT of cargo transported between January and June for a 63.7% year-over-year boost, the largest vessels in the market secured a 53.7% market share, whereas in H1 2021 they had carried about 33.5% of all Australian Grains. The most obvious testament to the Panamax contribution to the market is observed when the total quantity transported increasing by 2% year-over-year is compared to the 8% less voyages it took to carry it compared to 2021 counts. Naturally, this meant that every other fleet carrying Australian Grains experienced a year-over-year drop in cargo carried. Throughout H1 2022, Handysizes, Handymaxes, Supramaxes, and Ultramaxes transported 51.4%, 33.1%, 38.9%, and 7% less commodity, compared to their respective 2021 levels.
You can follow how the Australian Grain market develops using our Trade Flows tool. Trade Flows allows you to gain accurate intelligence on a macro- and micro-level on Dry Bulk vessel and commodity movements and trends.