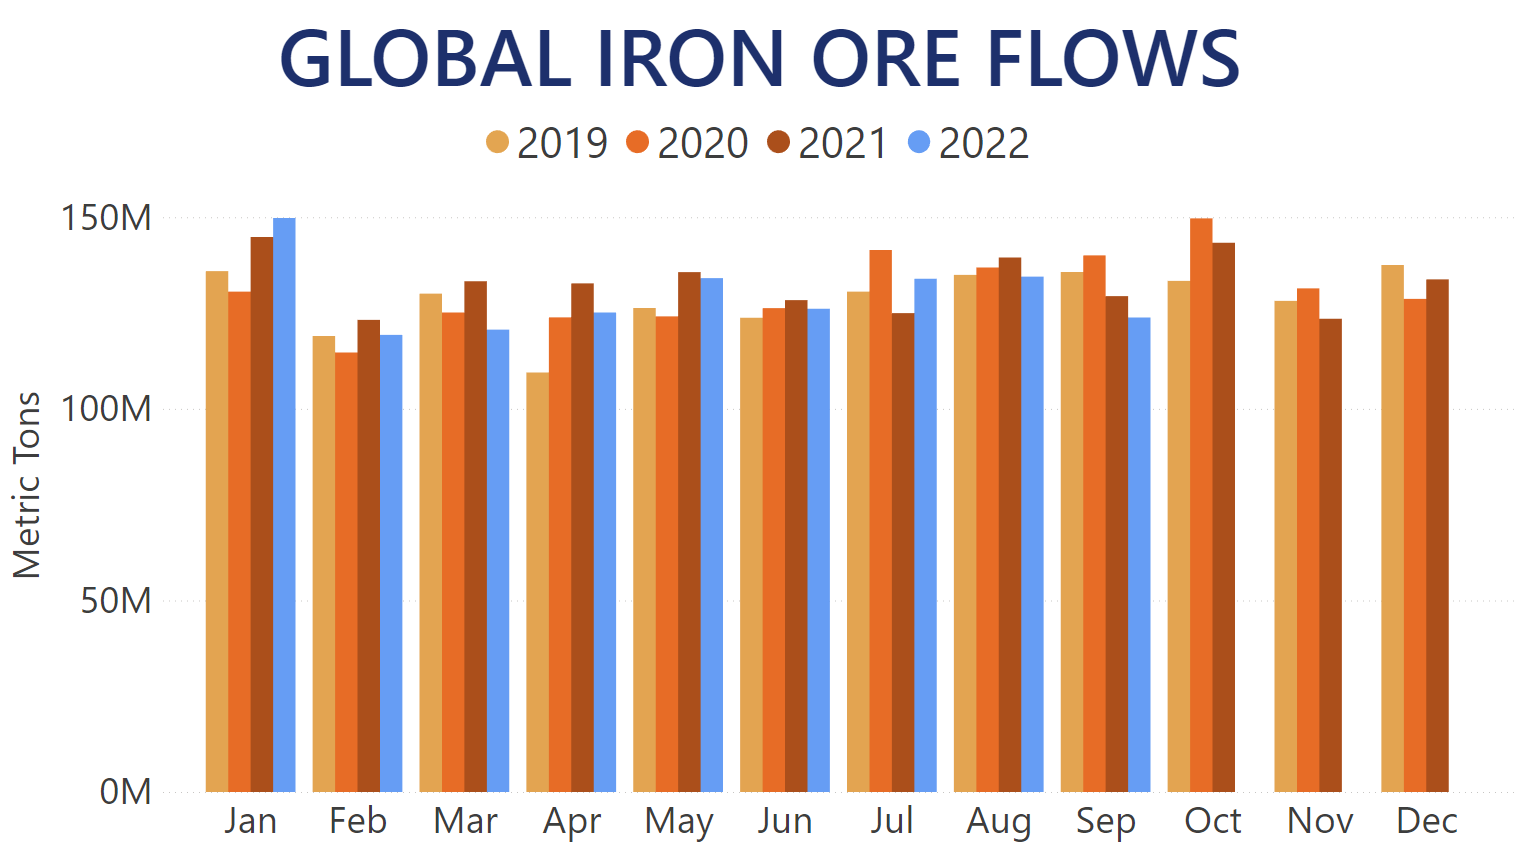
The resurgence of Iron Ore flows, which we covered back in July, turned out to be short-lived. Global shipments of the most common Dry Bulk commodity throughout the past two months returned to the 2022 trend of year-over-year regression. Our Trade Flows data indicates that 134.5m MT of Iron Ore was discharged across the globe in August and 123.9m MT in September. These quantities represent 3.6% and 4.3% year-over-year decreases for each respective month and were also at their lowest levels over the past 5 years.
Overall Iron Ore shipments around the globe in Q3 2022 totaled just under 392.4m MT. Due to the strong start of the quarter, this means that Q3 was the most prolific one since the start of the year. This was measured both in the highest quantity of Iron Ore transported by vessels compared to Q1 and Q2 of 2022, as well as the Q3 year-over-year decrease standing at 0.4%. By comparison, the first two quarters of this year each saw about 2.9% less cargo discharged worldwide compared to the same periods of 2021.
Total Iron Ore discharged globally throughout the first nine months of 2022 has exceeded 1,167m MT. While weaker year-over-year, it still places current-year performance above 2018 and 2020 levels so far.
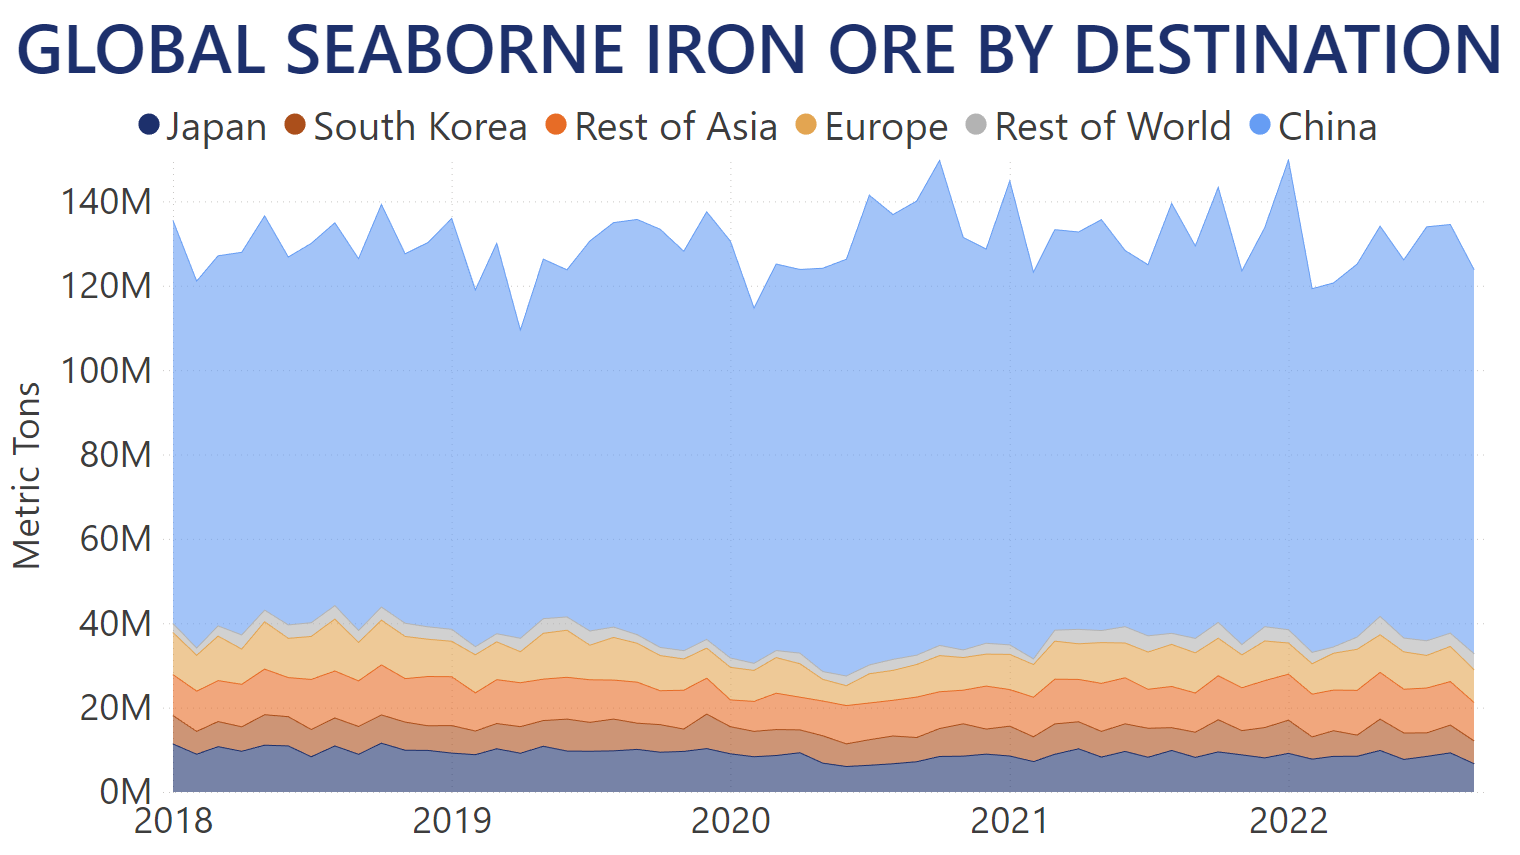
As the trend in the global Iron Ore market is set by China, the largest importer in the world discharged 96.8m MT of cargo in August and 91m MT in September. This represented 4.9% and 2.1% respective year-over-year decreases. Nevertheless, these quantities gave China a 72% market share in August and 73.5% in September, both higher than the average of 71.7% registered in the prior months of 2022. Overall, Chinese imports of Iron Ore in Q3 2022 stand at 286m MT, actually increasing by 1.1% year-over-year.
Japan, the second-largest single importer of Iron Ore, discharged nearly 9.3m MT of commodity at its ports in August for a 5.8% year-over-year decrease. Meanwhile, its import levels in September dropped even further to 6.7m MT, not only registering an 18.3% year-over-year drop, but also marking the lowest single-month quantity over the past two years.
Combined European imports of Iron Ore dropped to 8.3m MT in August and 7.7m MT in September, marking 16.5% and 18.7% year-over-year decreases, respectively. Overall quantities to the Old Continent have totaled just over 74.6m MT of cargo throughout the first nine months of 2022 – that's 6.9% less Iron Ore discharged across European ports compared to last year's levels.
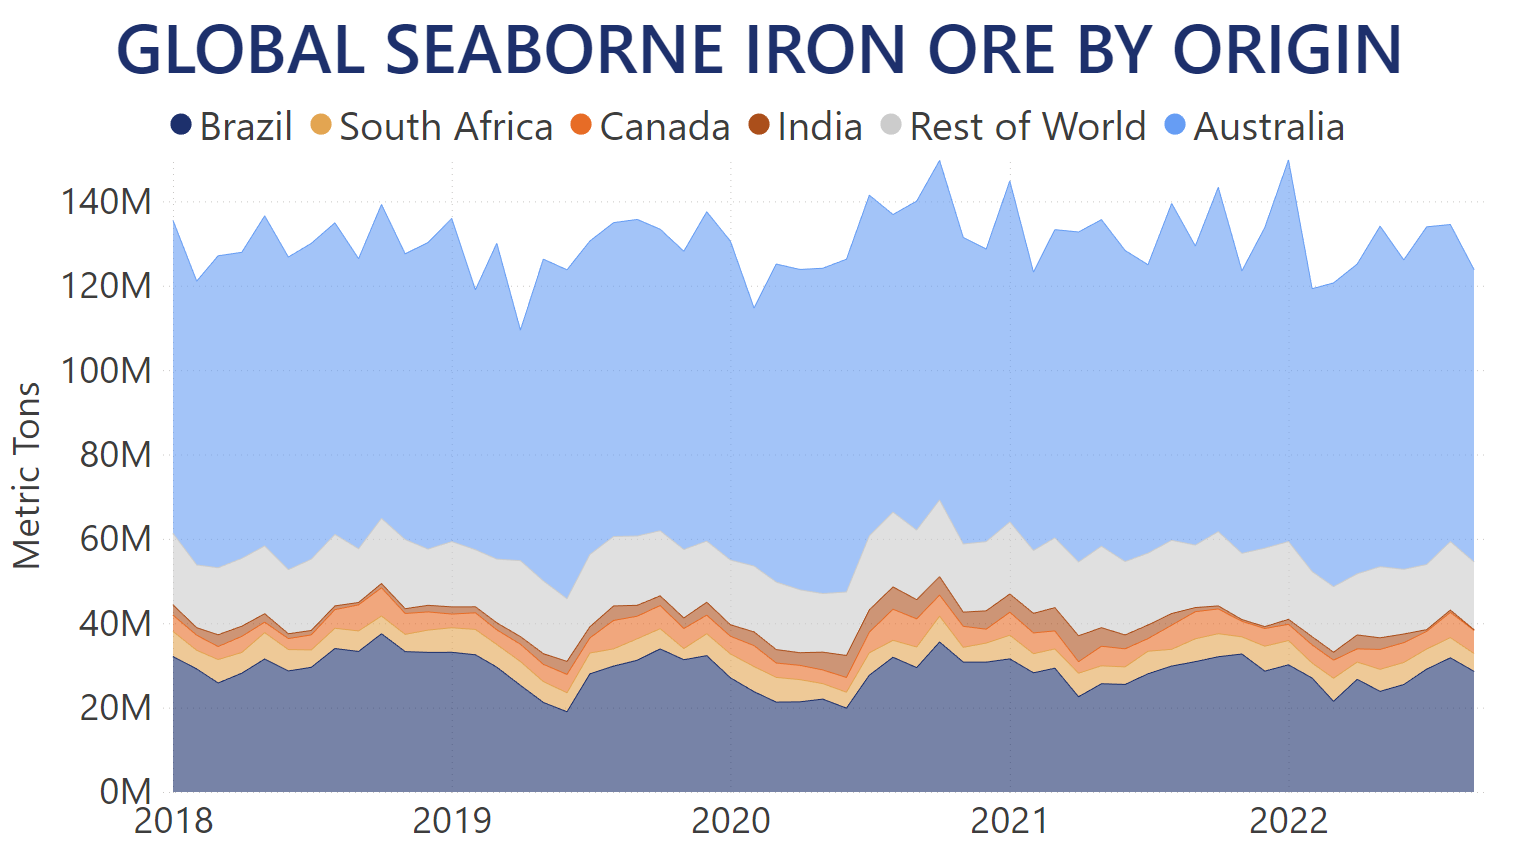
On the supply side, 75.2m MT and 69.3m MT of Iron Ore originating from Australia were unloaded across the globe in August and September, respectively. This translates into 5.9% and 2.3% year-over-year drops for each month for the world's largest exporter, subtracting about 6.3m MT from the market compared to last year's levels. It also meant that Australia's market share contracted to about 55.9% during the past two months, whereas its average stood at 59% since the start of the year. However, strong shipments in July meant that Australian Iron Ore exports in Q3 of this year outpaced 2021 levels by 2.5%, even if it was the weakest quarter so far in 2022.
Brazilian Iron Ore registered its highest discharge levels since the start of the year, with 31.8m MT unloaded in ports across the globe in August. While this meant a 6.5% year-over-year boost, it was offset by September discharges dropping to 28.6m MT for a 7.4% year-over-year decrease. Overall Q3 performance of Brazilian Iron Ore was stronger by 0.9% compared to 2021 levels with over 89.5m MT shipped worldwide.
While Canadian Iron Ore was also imported at a higher pace by 3.2% year-over-year in Q3, the strong quarterly performance by the top global exporters was offset nearly single-handedly by Indian exports dropping by 84.1% compared to 2021 levels. Iron Ore originating from India dried up almost completely, with only 1.1m MT discharged over the past three months, compared to the 7m MT unloaded throughout Q3 2021.
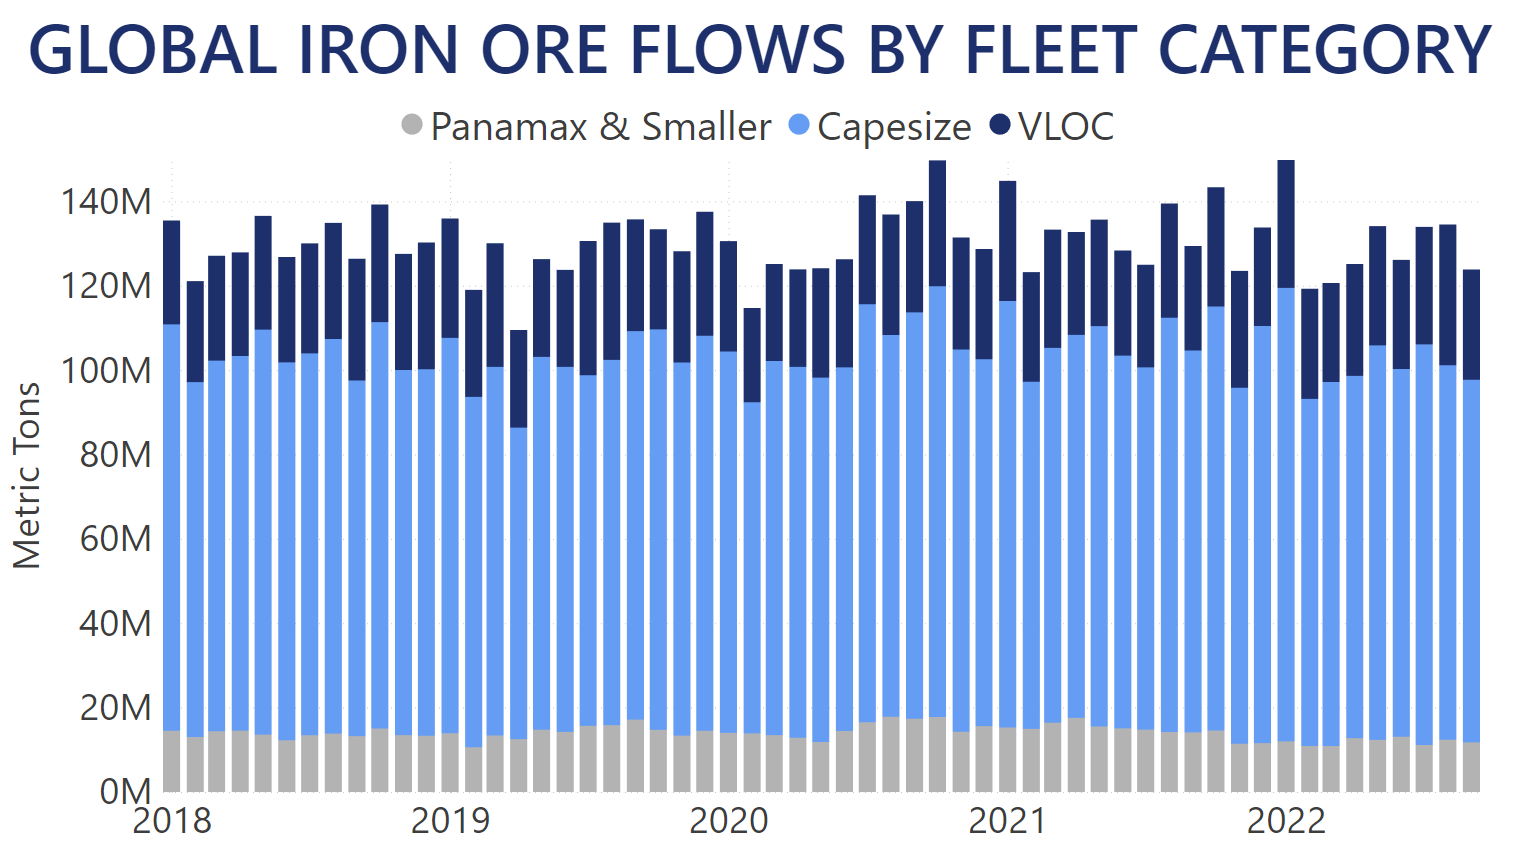
VLOC vessels over 220k MT of deadweight were the only fleet segment to see an improvement in utilization in this market over the past two months. Carrying 33.4m MT of Iron Ore in August and 26.2m MT in September, meant 23.2% and 5.5% year-over-year increases for the largest vessels. VLOCs also saw a record 24.8% market share in the Iron Ore market in August. The overall quantity shipped by the VLOC fleet in Q3 2022 increased by 14.6% year-over-year, and at 87.3m MT marked the second-highest single-quarter level, falling just behind the record set in Q3 2019.
Meanwhile, the most commonly used vessels in the Iron Ore market – Capesizes between 100k and 220k MT of deadweight – saw their market share drop to 66% in August and 69.4% in September against an average of 70.1% in the prior months since the start of 2022. Overall, Capes transported just under 270m MT of Iron Ore in Q3, registering a 1.8% drop year-over-year throughout the past three months.
You can use our Trade Flows tool to follow how the Iron Ore market develops further, as well as gain accurate intelligence on a macro- and micro-level on this and other topics relevant to your business. Book a demo below to see everything Trade Flows can do for you.